Figure 7.
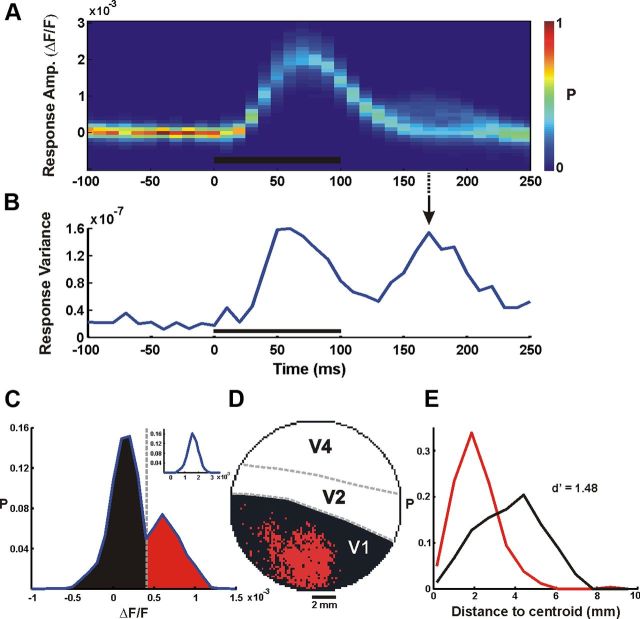
Spatial mapping of the late response. A, Example of VSDI amplitude distribution across V1 pixels as a function of time (one face stimulus imaging session, averaged over 30 trials, n = 2510 pixels, bin width = 10 ms). Color bar denotes normalized distribution; black bar denotes stimulus presentation time. B, The variance of the VSDI response across all V1 pixels, i.e., the spatial variance, as a function of time. C, Bimodal distribution in VSDI amplitude at time marked with arrow in B (t = 170 ms after stimulus onset). Dashed gray line marks the amplitude threshold for the mapping in D. Inset shows a unimodal amplitude distribution at t = 60 ms after stimulus onset. D, Neural activity map in V1 at t = 170 ms after stimulus onset. Black and red pixels are those below and above amplitude threshold, respectively. E, Distributions of distance-to-centroid of the black and red pixel groups in D.

