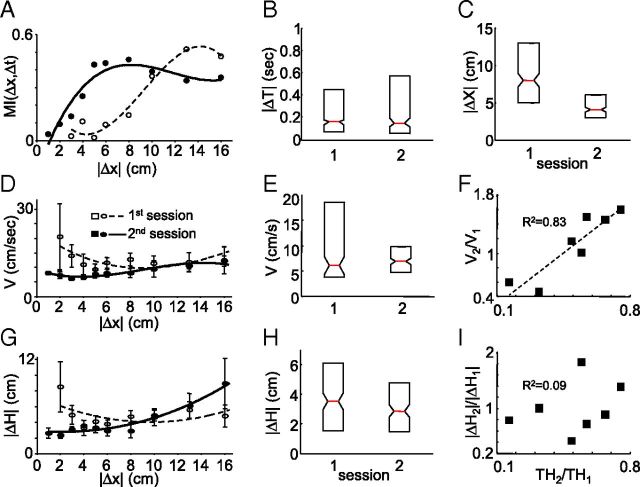
Figure 2.
Factors underlying improvement of localization between sessions across all participants. A, MI between Δx and Δt as a function of |Δx|. B, C, E, H, Median and quartile as exhibited in the first and second sessions of Δt, Δx, V, and ΔH, respectively. D, G, Average V and ΔH as a function of |Δx|. F, I, Ratio of V and ΔH across sessions as a function of the ratio of thresholds across sessions.

