Figure 3.
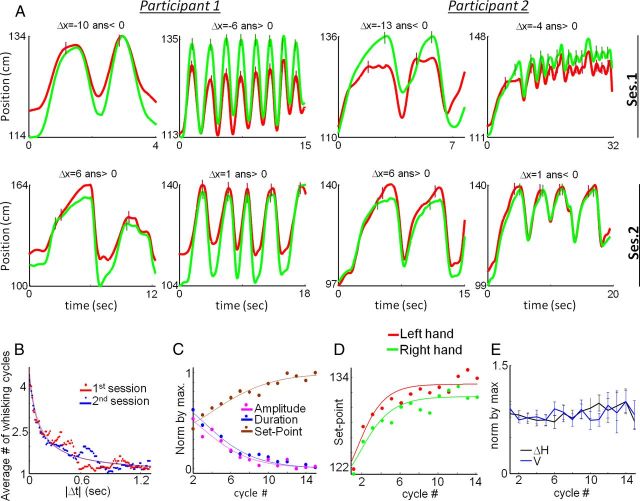
Kinematics of whisking cycles. A, Eight trial trajectories from two participants. In each trial, the position of the left (red) and right (green) hands are plotted as a function of trial time (note that scales differ). Colored vertical bars indicate contact onset times. Δx and the participant's perceptual report are denoted for each trial. B, Average number of whisking cycles in a trial as a function of Δt in Sessions 1 and 2 (n = 8 participants). Fitting parameters for Equation 5: Pdec = 0.77, σ = 379 ms, N∞ = 1.16, and R2 = 0.921 in Session 1; Pdec = 0.85, σ = 279 ms, and N∞ = 1.17, and R2 = 0.877 in Session 2 (p > 0.05, t test for each parameter). C, Average normalized whisking amplitude, duration and set point as a function of whisking cycle number. Fitting parameters of Equation 10: amplitude: aE = 6.74, α = 0.70, R2 = 0.93; duration: aT = 8.05, α = 0.71, R2 = 0.97; set point: aS = 8.44, α = 0.75, R2 = 0.94. D, Right and left hand set points as a function of whisking cycle number. Fitting parameters for (based on Eq. 10): right hand: as = 8.46, α = 0.58, b = 9.28 cm, c = 122.1 cm, R2 = 0.89; left hand: as = 8.79, α = 0.53, b = 8.99 cm, c = 124.1 cm, R2 = 0.89. E, Average normalized |ΔH| and V as a function of whisking cycle number. Data for graphs C–E were pooled from Sessions 1 and 2.

