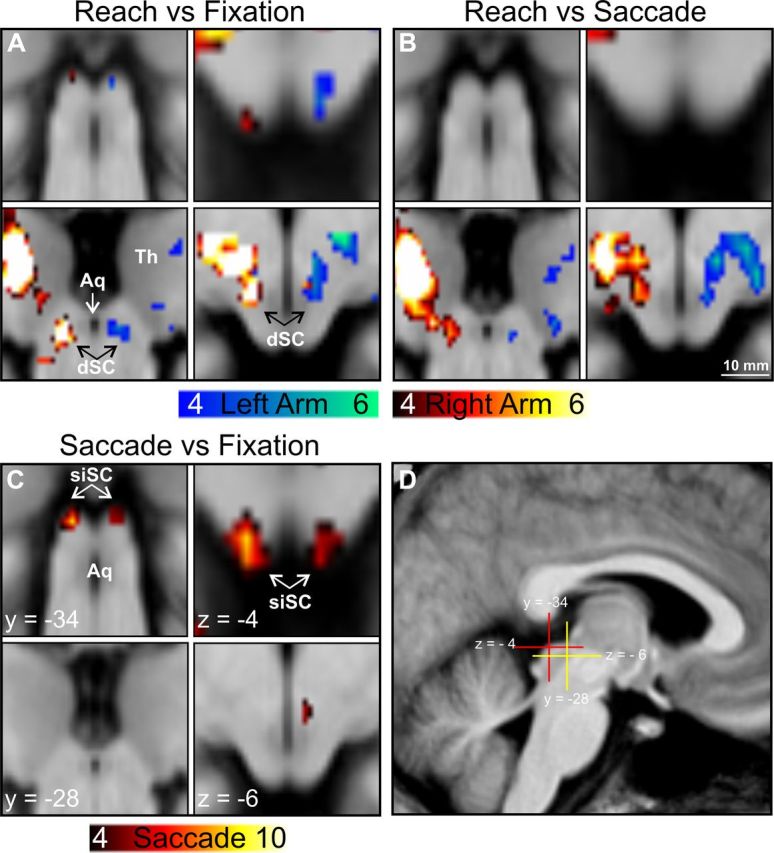
Figure 3.

Saccade- and reach-related signal increases in the SC in Experiments 1 and 2. Clusters are thresholded at p < 0.001 (uncorrected) for illustrative purposes and projected onto the group mean brain image. A, Reaching against fixation baseline resulted in significant signal increases in the contralateral superficial and intermediate positions of the SC (top) and in the deep layers extending into the underlying mesencephalic reticular formation (dSC; bottom). B, Contrasting reaching with saccades resulted in significant signal increases only at the dSC contralateral to the active arm. C, Contrasting saccades with fixation baseline revealed BOLD signal increases in the siSC bilaterally. D, Sagittal overview of the positions of the coronal and transversal slices shown in A–C. Blue color scale, Left arm reaching; red color scale, right arm reaching or saccades. Minimum and maximum T scores are presented in the color scales. Aq, cerebral aqueduct; Th, thalamus. Scale bar, 10 mm.
