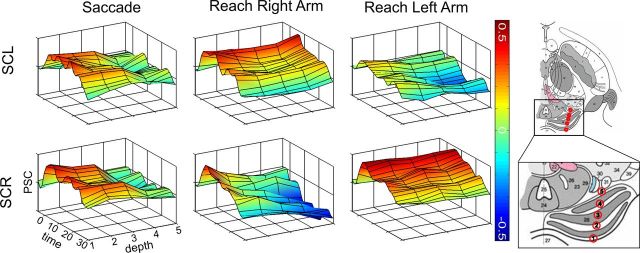
Figure 5.
Three-dimensional plots of mean BOLD signal time courses averaged across participants. Group averages of the signal time courses are shown for a period between 0 and 30 s after the respective block onset at five different depths in the SC. The individual signal peaks of each participant in the superficial/intermediate location of the SC provided the first position, and the respective individual peaks in the deep layers provided the fifth position. Additionally, we determined three positions equally distributed between the superficial and deep peaks, resulting in five regions of interest as illustrated in the sketch of the superior colliculus (adapted from Naidich et al. 2009, their Fig. 2.20, with kind permission of SpringerWien, New York). The color scale indicates the amplitude of percent signal changes with reference to a 3 s preblock baseline period. SCL, Left superior colliculus; SCR, right superior colliculus.

