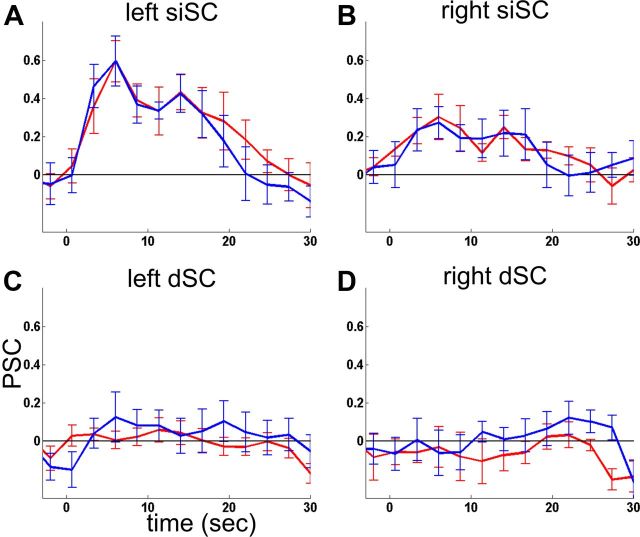
Figure 6.
Signal time courses Experiment 3. Group averages of the signal time courses are shown for a period between 0 and 30 s after the respective block at four a priori regions of interest defined by Experiments 1 and 2. Data were extracted from 2 mm spheres centered at the respective peak coordinates of Experiments 1 and 2. PSC, Percentage signal change. Red line, Horizontal saccades; blue line, vertical saccades. Error bars indicate the SE across participants.

