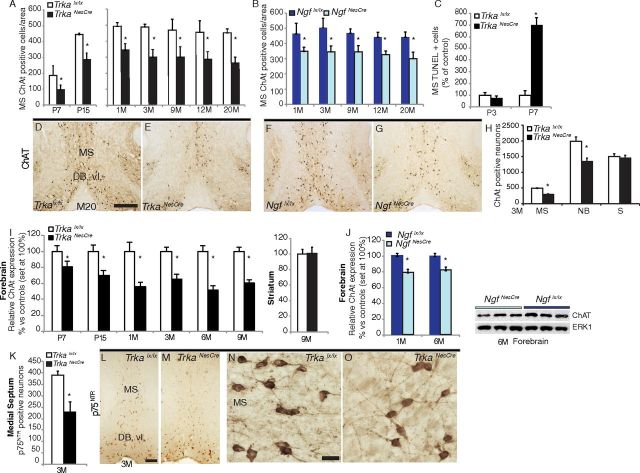
Figure 3.
CNS-specific deletion of Trka or Ngf affects survival of a small proportion of the BFCNs. A, Time course survival analysis of ChAT-positive cells in the MS of TrkaNesCre mutant and control mice. Stages of analysis were between postnatal day 7 and 20 months (20M) of age. The reduction in ChAT-positive cells was significantly different between mutants and controls at all stages analyzed (P7, p = 0.008; P15, p = 0.0015; 1 month, p = 0.0001; 3, 12, and 20 months, p < 0.0001; 9 months, p = 0.0008; n = 3 to 4 per group). B, Time course survival analysis of ChAT-positive cells in the MS of NgfNesCre mutant and control mice. Stages of analysis were between 1- and 20-month-old animals. The reduction in ChAT-positive cells was significantly different between mutants and controls at all stages analyzed (1 and 3 months, p < 0.0001; 9 months, p = 0.0002; 12 months, p = 0.0019; 20 months, p = 0.0002; n = 3 to 5 per group). C, TUNEL-positive cells in the medial septum of controls and TrkaNesCre mutants expressed as percentage of control littermates at P3 (controls, 100 ± 21%; TrkaNesCre, 78.6 ± 13%) and P7 (controls, 100 ± 40%; TrkaNesCre, 700 ± 60%, p = 0.014; n = 2 for all groups analyzed, values are ±SD). D–G, Histological sections stained with ChAT antibodies showing the MS and diagonal band vertical limb (DB-vl) of TrkaNesCre and NgfNesCre mutants and respective control mice at 20 months of age. H, Survival analysis of ChAT-positive neurons in different brain areas at 3 months of age. A significant difference was observed between TrkaNesCre mutant and control mice also in the nucleus basalis complex (p < 0.05; n = 3 to 4 per group). I, Time course of relative ChAT protein levels in forebrain of TrkaNesCre mutant and control mice. A significant reduction of ChAT expression between TrkaNesCre mutant and control mice was found at all stages analyzed (p < 0.05). No difference in ChAT expression was found in the striatum between mutants and controls. J, Relative ChAT protein levels in total forebrain lysates of NgfNesCre mutant mice at 1 and 6 months of age (p < 0.05), and representative Western blot showing ChAT levels at 6 months of age. K, Counts of p75NTR-positive neurons in the MS of 3-month-old TrkaNesCre mutant and control mice revealed significant reductions in the mutants (p = 0.028; n = 3 for each genotype). L–O, Representative images of p75NTR immunostaining showing normal appearance of cholinergic neurons of the MS and DB-vl in both controls and TrkaNesCre mutant sections. S, Striatum. Scale bars: (in D) D–G, 500 μm; L (for L, M), 200 μm; N (for N, O), 100 μm. *Statistically significant difference.

