
Figure 4.
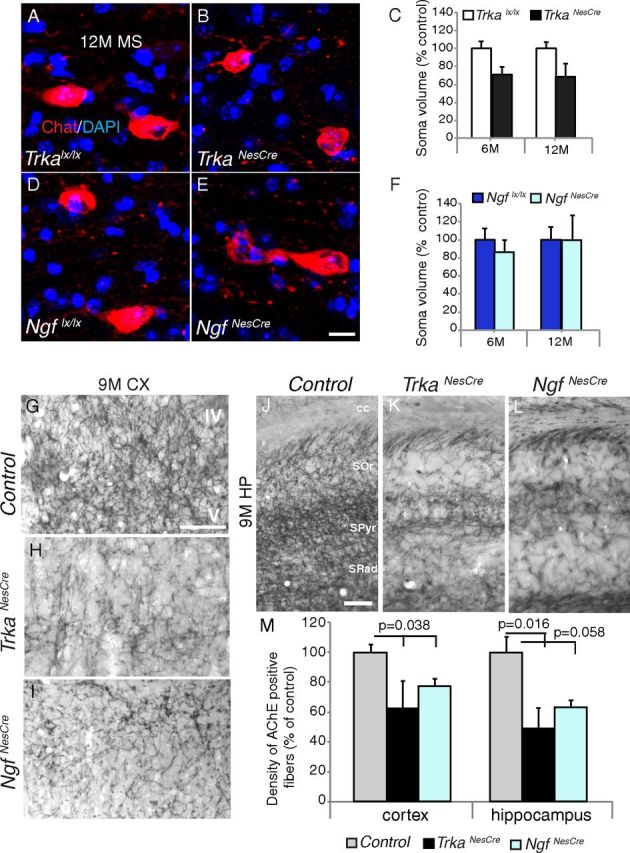
Morphological analysis of cholinergic neurons in Trka and Ngf conditional mutants. A–F, Soma volume quantification of MS cholinergic neurons in 12-month-old (12M) TrkaNesCre and NgfNesCre mutant and control mice stained with ChAT by IF staining. C, F, No significant statistical differences were detected between controls and mutants at both stages analyzed (TrkaNesCre, 6 months, p = 0.07; 12 months, p = 0.09, C; NgfNesCre, 6 months, p = 0.49; 12 months, p = 0.53, F; n = 3–4 mice for each group analyzed, 30 to 70 cells per animal per genotype). G–L, Sections showing somatosensory cortex (CX; G–I) or hippocampal regions (J–L) from control, TrkaNesCre, and NgfNesCre mice at 9 months (9M) of age stained with AChE. M, Quantification of AChE-positive fibers in frontal cortex and hippocampal regions of Trka and Ngf conditional mutants compared to controls [cortex, control, 100 ± 5.59, n = 7 (4 Trkalx/lx, 3 Ngflx/lx); TrkaNesCre, 62.24 ± 18.83, n = 4, p = 0.038; NgfNesCre, 76.64 ± 5.38, n = 3, p = 0.038; hippocampus, control, 100 ± 10.47, n = 7 (4 Trkalx/lx, 3 Ngflx/lx); TrkaNesCre, 48.75 ± 14.08, n = 4, p = 0.016; NgfNesCre, 62.95 ± 4.28, n = 3, p = 0.058]. IV and V indicate cortical layers IV and V, respectively. cc, Corpus callosum; SOr, stratum oriens; SPyr, stratum pyramidale; SRad, stratum radiatum. Scale bars: (in E) A, B, D, E, 10 μm; G (for G–I), J (for J–L), 100 μm.