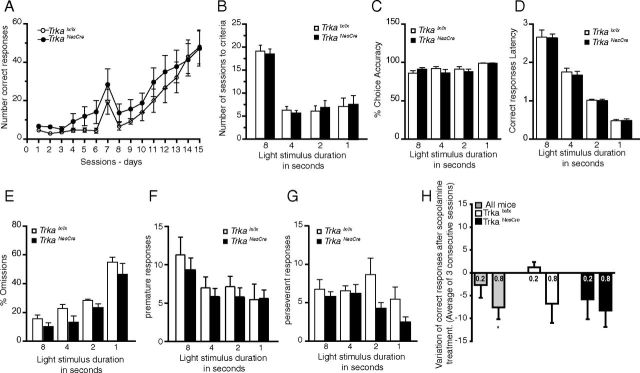
Figure 6.
Attention performances in the 2-CSRTT. Young adult TrkaNesCre mice (n = 14) and age-matched controls (n = 14) were used in this test. A, Number of correct responses per session for the first 15 d of the test at 8 s stimulus light duration. Both mutant and control mice showed similar learning curves with no significant differences between the two groups (except for day 2, where mutants were performing better than controls; TrkaNesCre, 6.26 ± 0.99 vs controls, 2.85 ± 0.57; p = 0.007). B, Number of sessions needed to reach performance criteria at 8, 4, 2, and 1 s stimulus (light) duration. No significant difference was observed between mutants and control mice in the three blocks of the test (p = 0.76, p = 0.55, p = 0.66, and p = 0.885, respectively). C, Choice accuracy (percentage of correct responses) at 8, 4, 2, and 1 s stimulus duration was also analyzed, and no differences were found between mutants and controls (p = 0.2, p = 0.21, p = 0.77, and p = 0.99, respectively). D, Analysis of latency to a correct response also showed no significant differences in the attention performance between mutants and controls (8 s, p = 0.52; 4 s, p = 0.59; 2 s, p = 0.91; 1 s, p = 0.929). E, Omission is used as an index of motivation of the mice tested. The percentage of omissions was not significantly different between the two groups (8 s, p = 0.16; 4 s, p = 0.09; 2 s, p = 0.1; 1 s, p = 0.39). F, G, The premature responses during the fixed 5 s ITI were also measured (8 s, p = 0.48; 4 s, p = 0.49; 2 s, p = 0.44; 1 s, p = 0.96; F), as well as perseverative responses after correct choices at the different stimulus durations (8 s, p = 0.50; 4 s, p = 0.77; 2 s, p = 0.058; 1 s, p = 0.11; G). No significant differences were found between mutants and controls. H, Attention performance was also studied after scopolamine injections (0.2 or 0.8 mg/kg) at the 1 s stimulus duration level (mutants, n = 5; controls, n = 4). Scopolamine was injected 20 min before the test. Results are expressed as the variation between the means of correct responses obtained in three consecutive sessions before and after scopolamine treatment. Injections of scopolamine at a concentration of 0.8 mg/kg significantly reduced the number of correct responses (*p < 0.05, paired t test comparing the average of correct responses in untreated and treated mice for all the mice treated with 0.8 mg/kg of scopolamine). The responses of each subgroup are also shown.

