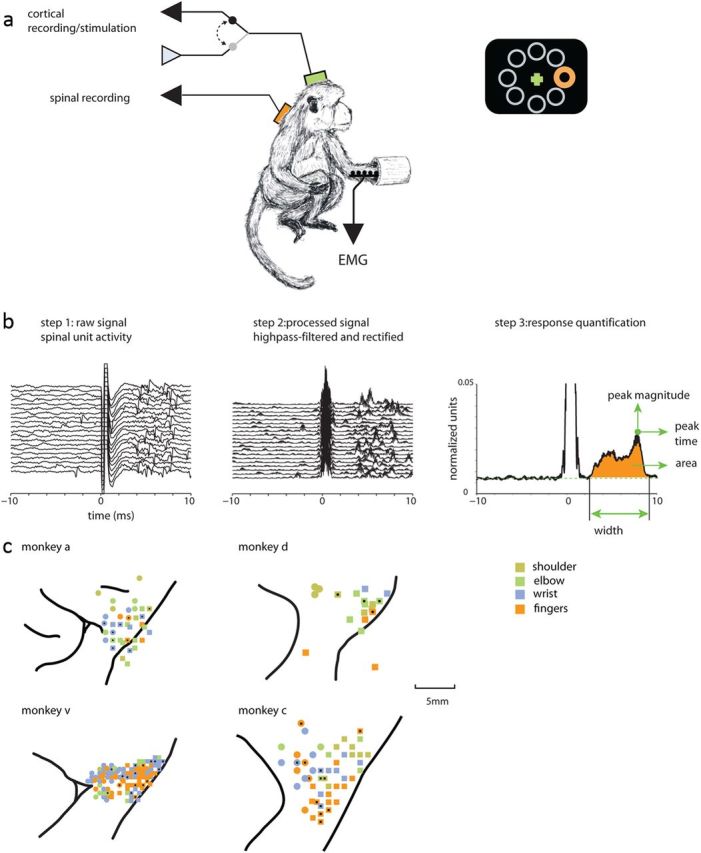
Figure 1.

Experimental setting and recording maps. a, Monkeys sat in a primate chair and controlled an on-screen cursor by applying an isometric two-dimensional torque at the wrist. Recordings were made from the motor cortex, cervical spinal cord, and arm muscles (EMG). Cortical electrodes were used for both recording and stimulating the tissue. Stimulations (at least 200 single pulses applied at 3 Hz) were applied while monkeys performed the task. b, To quantify the spinal response to cortical stimulation, the raw spinal recordings (step 1) were processed by high-pass filtering and rectification (step 2). The SD across the sweeps was used to quantify the response. For each significantly responsive spinal site, we calculated the response width, area, peak time, and peak magnitude (step 3). c, Cortical recording maps showing the relations between the recording sites and the nearby sulci. Only arm-related sites that were identified as either M1 (squares) or PM (circles) are shown. Color coding showing the different joint movements evoked by near-threshold stimulation in each site. For monkeys A, D, and V, black dots mark CS connected sites. For monkey C, the black x's show sites where cortical stimulation was applied to measure muscle field size.
