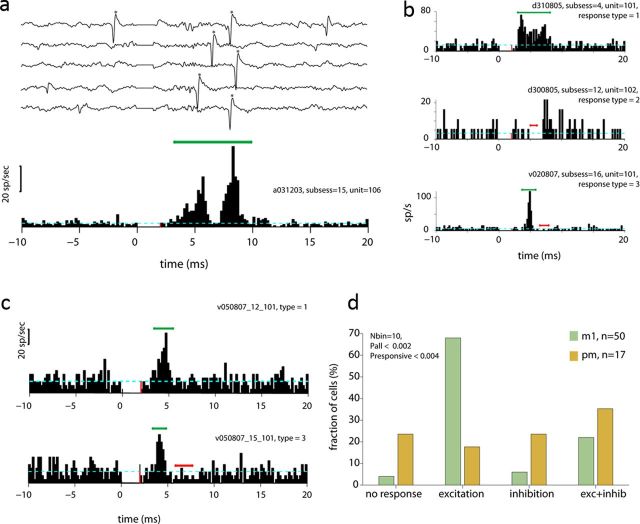
Figure 4.
Responses of single spinal cells to cortical stimulation. a, Examples of single traces and PSTHs of a single spinal unit (denoted by asterisks). In the PSTH, green/red lines mark sets of bins that were significantly larger/smaller than background firing. Significant bins in this example and in the entire figure were calculated using a 2 ms time window (i.e., 10 successive bins) shifted in steps of 0.2 ms. We used the center of each significant window for indicating significant bins. Dashed blue line corresponds to the background firing rate computed during the prestimulus period (−20 to −10 ms before stimulus onset). In this case, a double-peak excitation was followed by a period of decreased firing. b, Three examples showing the different responses that were observed: excitation (top), inhibitory (middle), and excitatory-inhibitory (bottom) patterns. c, An example in which a single spinal cell was affected by stimulation in both M1 (top) and PM (bottom) sites. Note that whereas M1 only excited the cell, PM exerted both excitation and inhibition. d, Summary of the different response patterns evoked in spinal neurons by stimulation in M1 (green bars) and PM (brown bars) sites. The significance level for M1 and PM evoked responses are shown for the entire set of neurons and only the responsive cases.

