Figure 5.
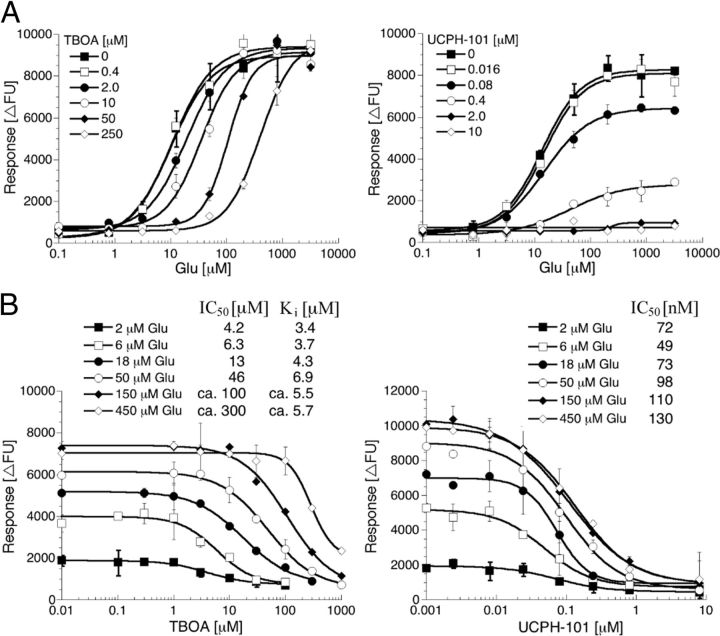
The nature of inhibition exerted by TBOA and UCPH-101 at EAAT1-HEK293 cells in the FLIPR Membrane Potential Blue assay. A, Concentration–response curves for Glu in the absence or the presence of five different concentrations of TBOA or UCPH-101. B, Concentration–inhibition curves for TBOA and UCPH-101 using six different Glu concentrations. Ki values for TBOA were calculated using the Cheng-Prusoff equation [Ki = IC50/(1 + [Glu]/Km)] (Craig, 1993). The figures show data from single representative experiments of a total of 3 or 4 experiments, and data are given as mean ± SD of duplicate determinations.

