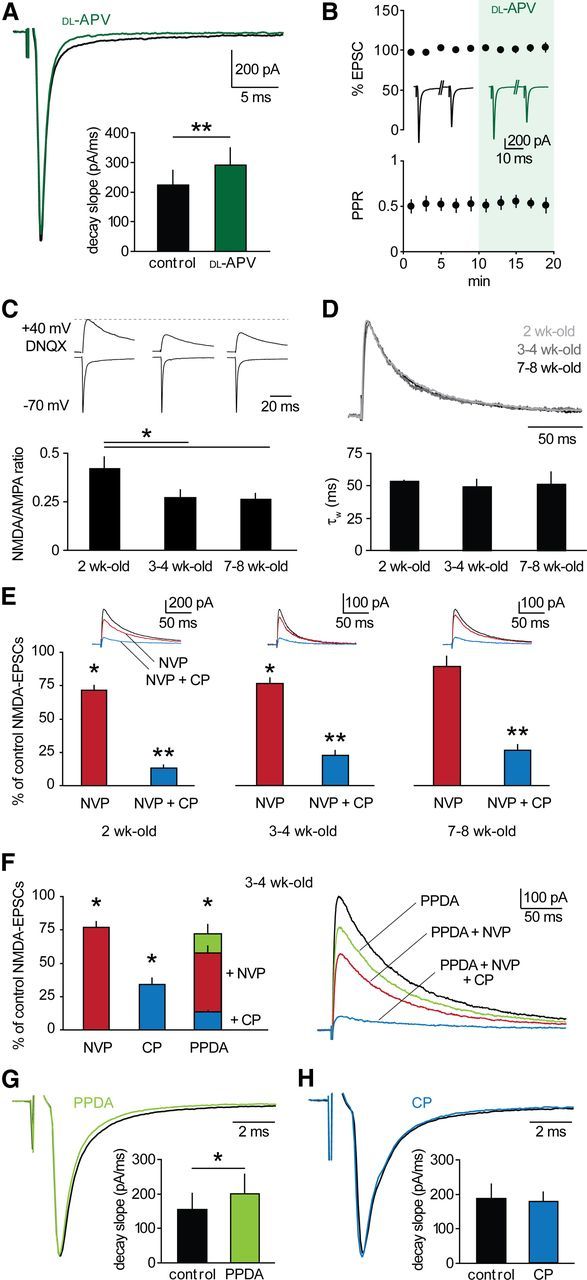
Figure 2.

GluN2B-NMDARs dominate at thalamoreticular synapses. A, Thalamoreticular EPSCs in a cell voltage-clamped at −70 mV in control (black) and in the presence of 100 μm dl-APV (green). NMDAR blockade induced an increase in decay slope (bars; n = 9; p < 0.01). B, NMDAR blockade did not affect EPSC peak and PPR (n = 9, p > 0.05). Inserted traces are average EPSCs in control and in dl-APV. C, Top, examples of AMPAR- and NMDAR-mediated components at −70 mV and +40 mV, respectively. NMDA-EPSCs were isolated with 40 μm DNQX. Bottom, NMDA/AMPA ratio significantly decreased after 2 weeks (2-week-old, n = 9; 3- to 4-week-old, n = 14; 7- to 8-week-old, n = 10, *p < 0.05). D, Top, overlay of scaled NMDA-EPSCs at different developmental stages, coded in gray scale. No change in decay kinetics occurred, as indicated by comparable values of weighted τ (τW) of biexponential fit (bars: 2-week-old, n = 6; 3- to 4-week-old, n = 16; 7- to 8-week-old, n = 6). E, Pharmacological profile of NMDA-EPSCs (2-week-old, n = 6; 3- to 4-week-old, n = 8; 7- to 8-week-old, n = 6). Upper insets, example NMDA-EPSCs showing progressive reduction of control responses (black) after superfusion of NVP (red) and NVP+CP (blue). F, Left, mean effects of GluN2-specific blockers in 3- to 4-week-old mice (NVP, n = 8; CP, n = 8; PPDA, n = 7). Right, example NMDA-EPSCs showing progressive reduction upon blocker superfusion, as indicated. G, H, EPSCs in a cell voltage-clamped at −70 mV in control (black) and in the presence of 500 nm PPDA (G, green) or 10 μm CP (H, blue). GluN2C/D inhibition induced an increase in decay slope (bars; n = 8; p < 0.05), whereas GluN2B blockade had no effect (bars; n = 6; p > 0.05). *p < 0.05, **p < 0.01 drug versus control.
