Figure 8.

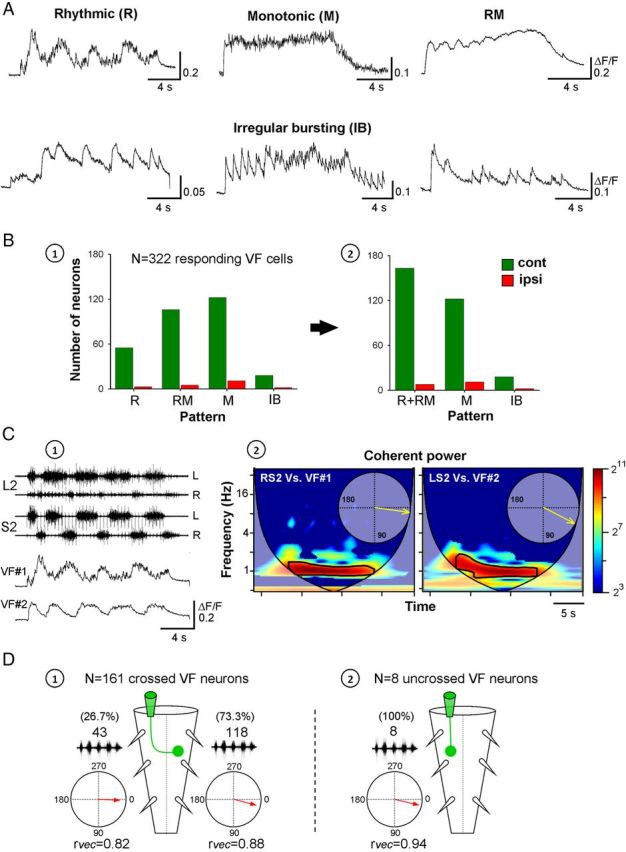
The activity patterns and phase preference of sacral VF neurons during SCA stimulation. A, Activity patterns of VF neurons (ΔF/F) during SCA stimulation. Top, bottom: VF cells with typical rhythmic (R), monotonic (M), monotonic with superimposed oscillations (RM), and irregular bursting (IB, 3 examples) patterns of activity. Stimulation parameters: Co1 dorsal root stimulation, R: 40-pulse 3-Hz train at 9 μA; M: 40-pulse 3.3-Hz train at 16 μA; RM: 30-pulse 3.3-Hz train at 12 μA; IB (left): 40-pulse 2.5-Hz train at 10 μA; IB (middle): 60-pulse 4-Hz train at 30 μA; IB (right): 40-pulse 2.5-Hz train at 12 μA. B, Distribution of the types of activity patterns exhibited by VF neurons labeled ipsilateral (red) or contralateral (green) to the injection site of the calcium sensor is shown before (B1) and after (B2) pooling the R and M group into a combined R + RM group used for subsequent analyses of the phase preference of rhythmic VF neurons. C, Differential phase preference of VF neurons during SCA. Relative fluorescence changes in two VF neurons (VF1 and VF2) at the right S2 are shown with the concurrently recorded motor output from the left and right S2 and L2 ventral roots during SCA stimulation (C1). The coherent cross-power density spectra (C2) show that VF1 and VF2 were in phase with the right and left S2 activity, respectively. The high-power frequency bands of the two spectra are delineated with black lines, and the phase plots are shown in the respective insets (C2). Stimulus train: 40 pulse 3 Hz at 9 μA. The neurons were back-labeled through the right VF at the lumbosacral junction. D, An illustrated summary of the phase preferences of VF neurons that exhibit oscillatory drive (R + RM group) with crossed projections (D1) and uncrossed projections (D2). The circular plots show the phase with the motor output either ipsilateral or contralateral to the somata of the labeled VF neurons.
