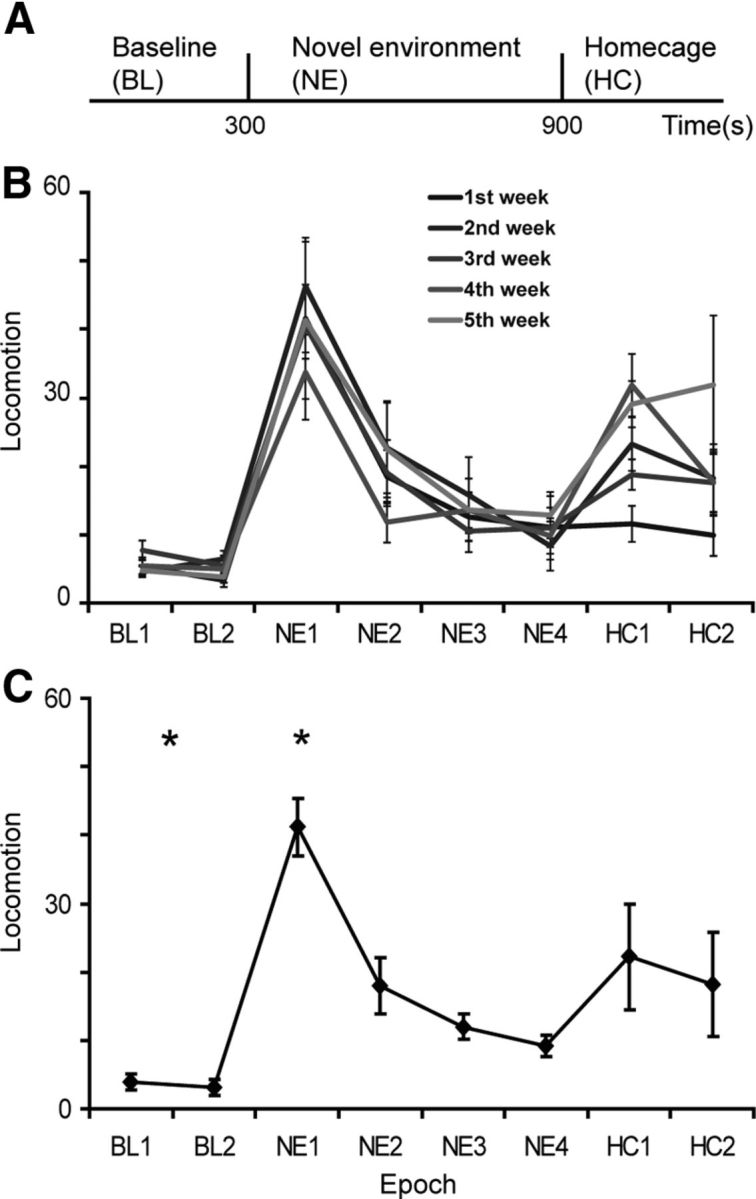
Figure 1.

Behavioral characteristics during novel environment exposure. A, Experimental timeline of each session. B, Weekly average of the number of gridline crossings per 2.5 min bins. C, Average over all sessions and animals of the number of gridline crossings in 2.5 min bins. Error bars are confidence intervals of the mean (2*SEM).
