Figure 2.
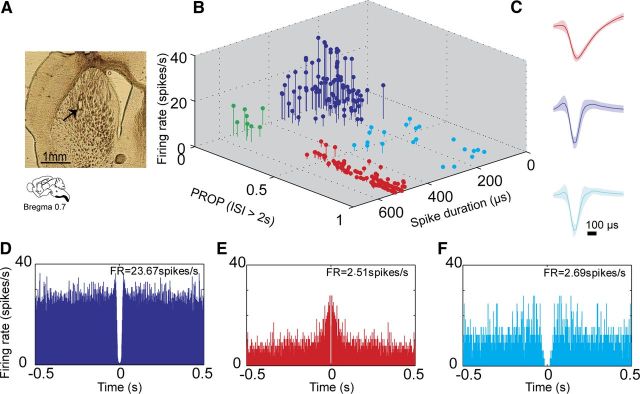
Striatal neurons exhibit unique characteristics enabling their classification into distinct cell types. A, Electrode arrays were positioned in the mouse dorsolateral striatum. An example of electrode placement marked with an electrolytic lesion in a 60 μm coronal slice. B, 3D scatter plot of waveform parameters and firing characteristics of sorted single neurons (n = 233) showing 4 distinct clusters, each corresponding to a different striatal cell type. MSNs (n = 110) were marked in red, FSIs (n = 94) were marked in blue, TANs (n = 8) were marked in green, and UINs (n = 21) were marked in cyan. The parameters used for the classification of each cell type appear in Table 1. C, The average waveform of the MSNs (top), FSIs (middle), and UINs (bottom) showing the similarity in waveform parameters between the FSIs and UINs. D–F, Examples of typical autocorrelation functions calculated in 1 ms bins for a FSI (D), an MSN (E), and a UIN (F). The MSN autocorrelation has a clear peak in the short ISIs indicating its tendency to exhibit burst activity. This peak is lacking in the UIN autocorrelation function despite having similar firing rates of ∼2.5 spike/s.

