
Figure 4.
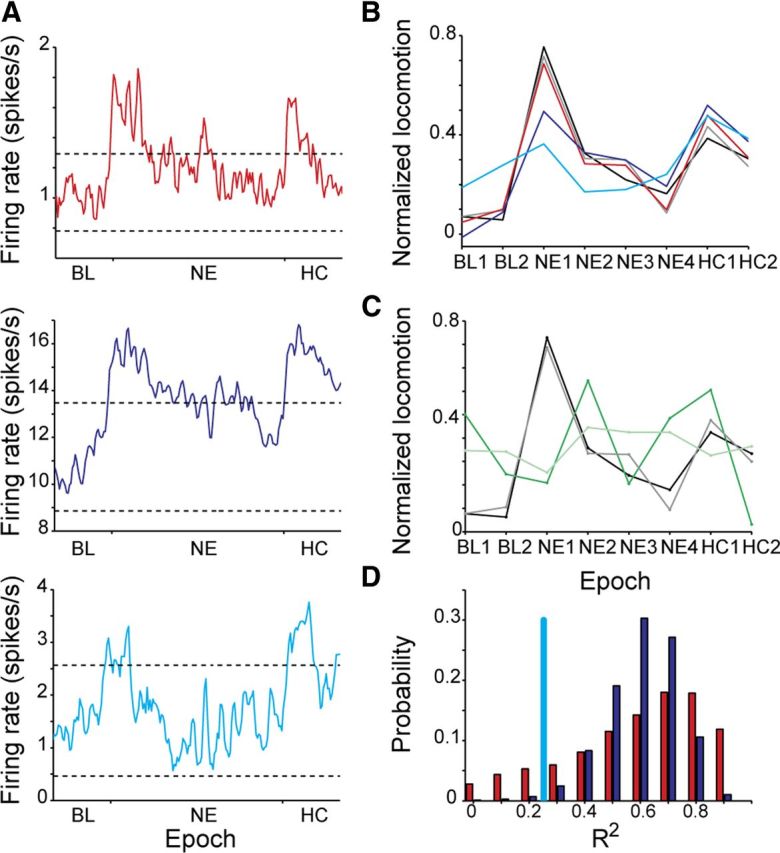
The MSNs and FSIs approximate locomotion significantly better than the UINs. A, The time courses of the average neuron of the MSNs (red), FSI (blue), and UIN (cyan) calculated using all recorded neurons within each cell-type. Dashed lines represent mean firing rate at baseline ±2*SD. B, Linear regression analysis using the firing pattern of the average neuron shows that both MSNs and FSIs estimate locomotion significantly better than the UINs. The black line is the normalized average locomotion over all animals and experiments. The colored lines are the results of the linear regression using the average neuron of all cell types (gray), MSNs (red), FSIs (blue), and UINs (cyan). The regression using the UINs was not significant. C, The linear regression model did not perform well when locomotion vectors were randomly drawn from a distribution having the same average and SD as the measured locomotion. Shown is an example of a randomly selected locomotion vector (green) and the linear regression result using the average neuron of all cell groups (light green). The black and gray lines are the same as in B. D, Distribution of R2 values calculated using 10,000 repetitions of the linear regression model in which each time n = 21 MSNs (red) or n = 21 FSIs (blue) were randomly drawn. The R2 value of the regression analysis using the sampled UINs (n = 21) is shown in cyan.