
Figure 1.
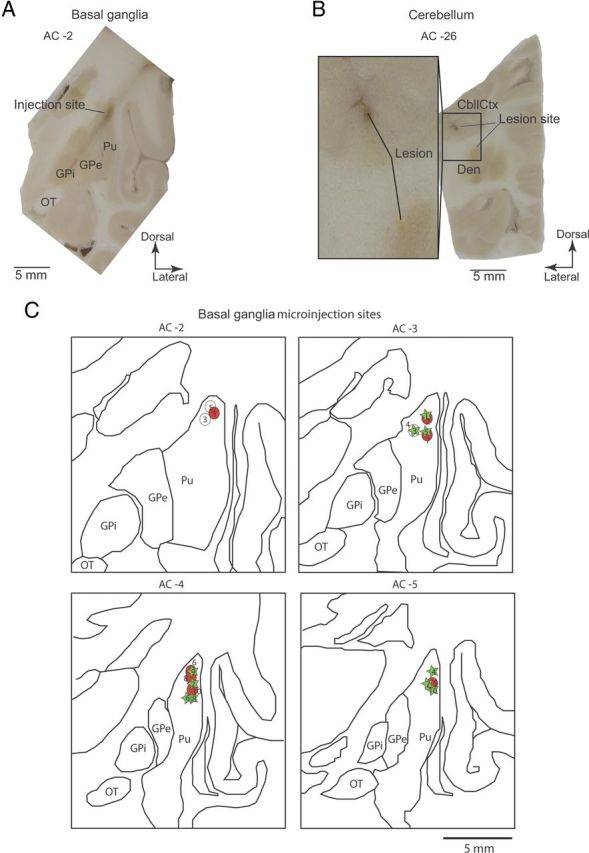
Anatomical reconstruction of injection and recording sites. A, Image of coronal section of the left hemisphere from Monkey R, showing gliosis formed by recording electrode trajectories, and microinjection sites that were targeted to dorsolateral putamen AC-2. Pu, Putamen; OT, optic tract. B, Electrolytic marking lesions made before animals were killed, targeted to the right CbllCx and dentate nucleus, at regions that were highly active before tic initiation. Den, Dentate nucleus. C, Outline drawings reconstructed from the coronal sections of the left hemisphere of Monkey R. The projected injection sites are derived from electrophysiological mapping and postmortem reconstructions from each animal overlaid on the same sections and are summarized in Table 1. Circles, Monkey R; stars, Monkey B.