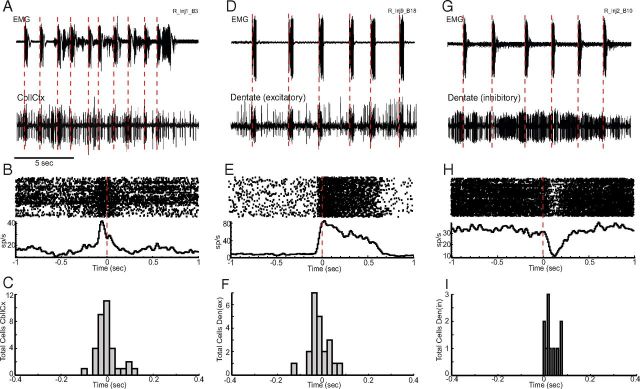
Figure 2.
Tic-related firing of cerebellar neurons. A, Examples of raw data from EMG (top trace) and activity of a single CbllCx neuron (bottom trace) after administration of bicuculline. EMG is recorded from the orofacial region. The large voltage transients are tic events. B, Quantification of the increase in tic-related rate firing expressed as a perievent raster and histogram. Neuronal activity is aligned to tic onset. C, Histogram representing the distribution of response latencies in CbllCx relative to tic onset. D, Examples of a raw neuronal recording of an excitatory dentate nucleus cell associated with tic events. E, Perievent raster and histogram of the cell shown in D. F, Histogram representing the distribution of response latencies of excitatory dentate nucleus neurons. G, Raw neuronal recording in conjunction with EMG activity of a typical inhibitory dentate cell. H, Perievent raster and histogram of the cell shown in G. I, Histogram representing the distribution of response latencies of inhibitory dentate nucleus neurons. Note the late onset of activity relative to tic activity.

