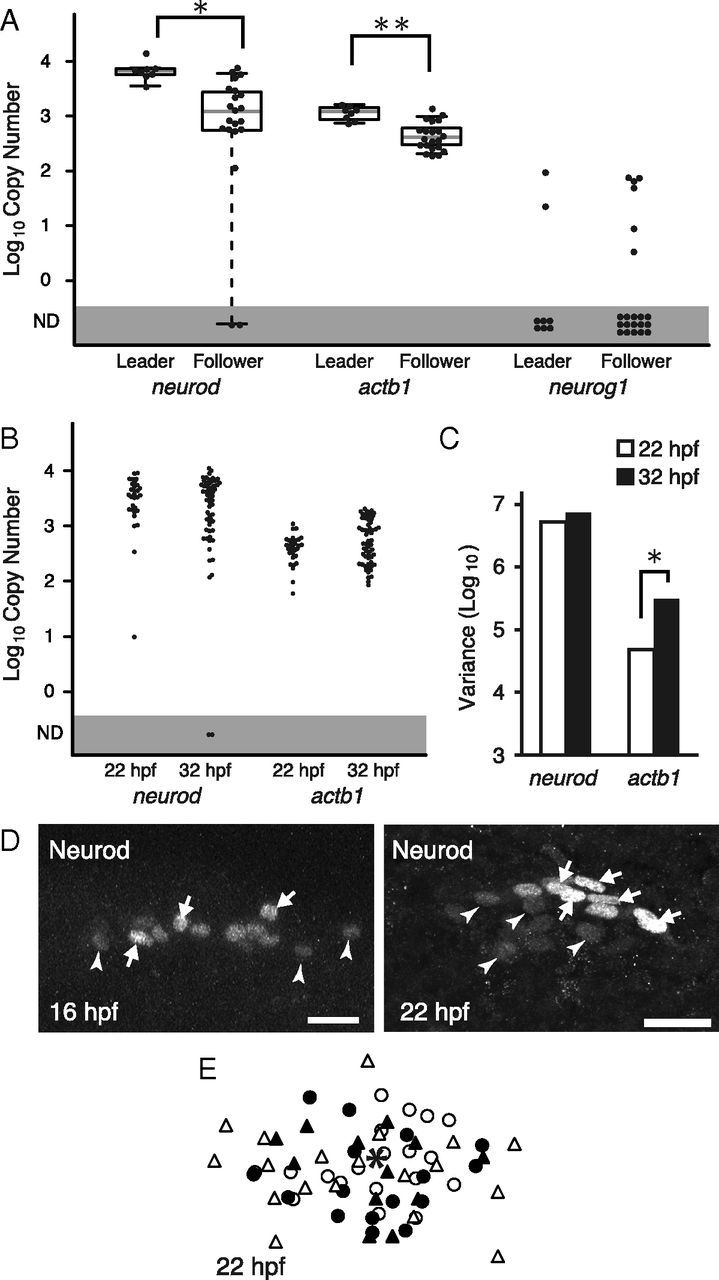
Figure 2.

Expression of candidate genes involved in the neuronal specification. A, The expression levels of neurod and actb1 in leaders are significantly higher than those in followers (*p = 0.0007, **p = 0.0003, Wilcoxon rank sum test), while in neurog1, no significant differences are observed. B, The expression levels of neurod and actb1 at 22 and 32 hpf. The mean expression levels do not significantly change. C, The variance in neurod and actb1 expression levels of individual neurons. In neurod, no significant changes in expression variance between 22 and 32 hpf were observed (p = 0.14, Levene test). By contrast, in actb1, the variance is significantly increased at 32 hpf compared with 22 hpf (*p = 0.00016). D, Immunostaining of Neurod. Neurod level is heterogeneous at earlier stages, 16 and 22 hpf. Qualitatively, high-intensity cells (white arrows) and low-intensity cells (white arrowheads) are intermingled in a PLL ganglion. Scale bars, 20 μm. E, Superimposed image of NeuroD+ cells at 22 hpf. The centroid of the ganglion (indicated by an asterisk) was used to normalize their positions. Neurons in an individual ganglion are indicated by an identical symbol.
