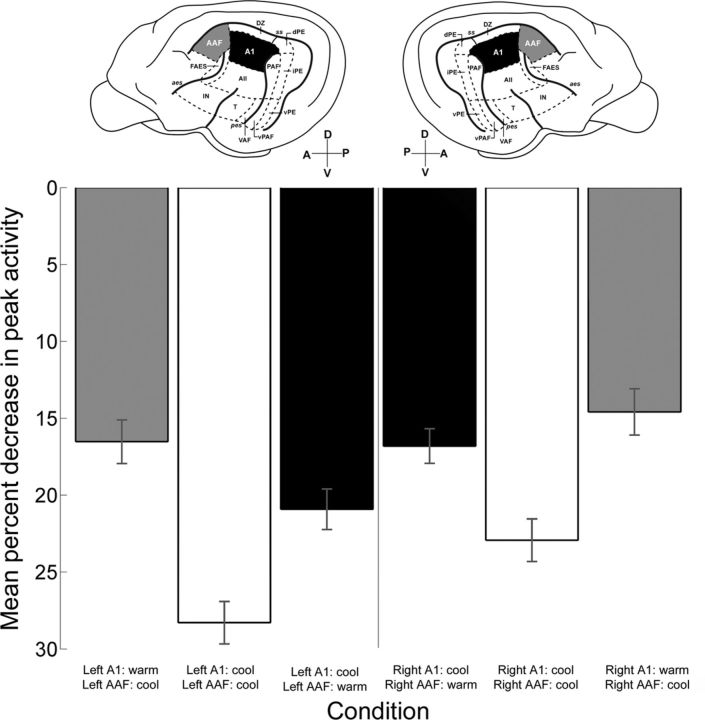
Figure 13.
Comparison of variations in A1 peak response across hemispheres. Mean percentage decreases in A1 peak activity during cooling deactivation of contralateral A1 (black bars), simultaneous contralateral A1 and AAF (white bars), and contralateral AAF (gray bars). The left side of the figure illustrates recordings conducted in right hemisphere A1, and the right side of the figure represents recordings from left hemisphere A1. Histograms show mean ± SEM. Left hemisphere recordings: n = 324 (73 noise bursts; 53, pure tones; 198 FM sweeps), right hemisphere recordings: n = 434 (101 noise bursts; 78, pure tones; 434 FM sweeps). Data analyses failed to reveal statistical significant variations between hemispheres (Kruskal–Wallis tests, p < 0.05, followed by post hoc Tukey–Kramer corrections).

