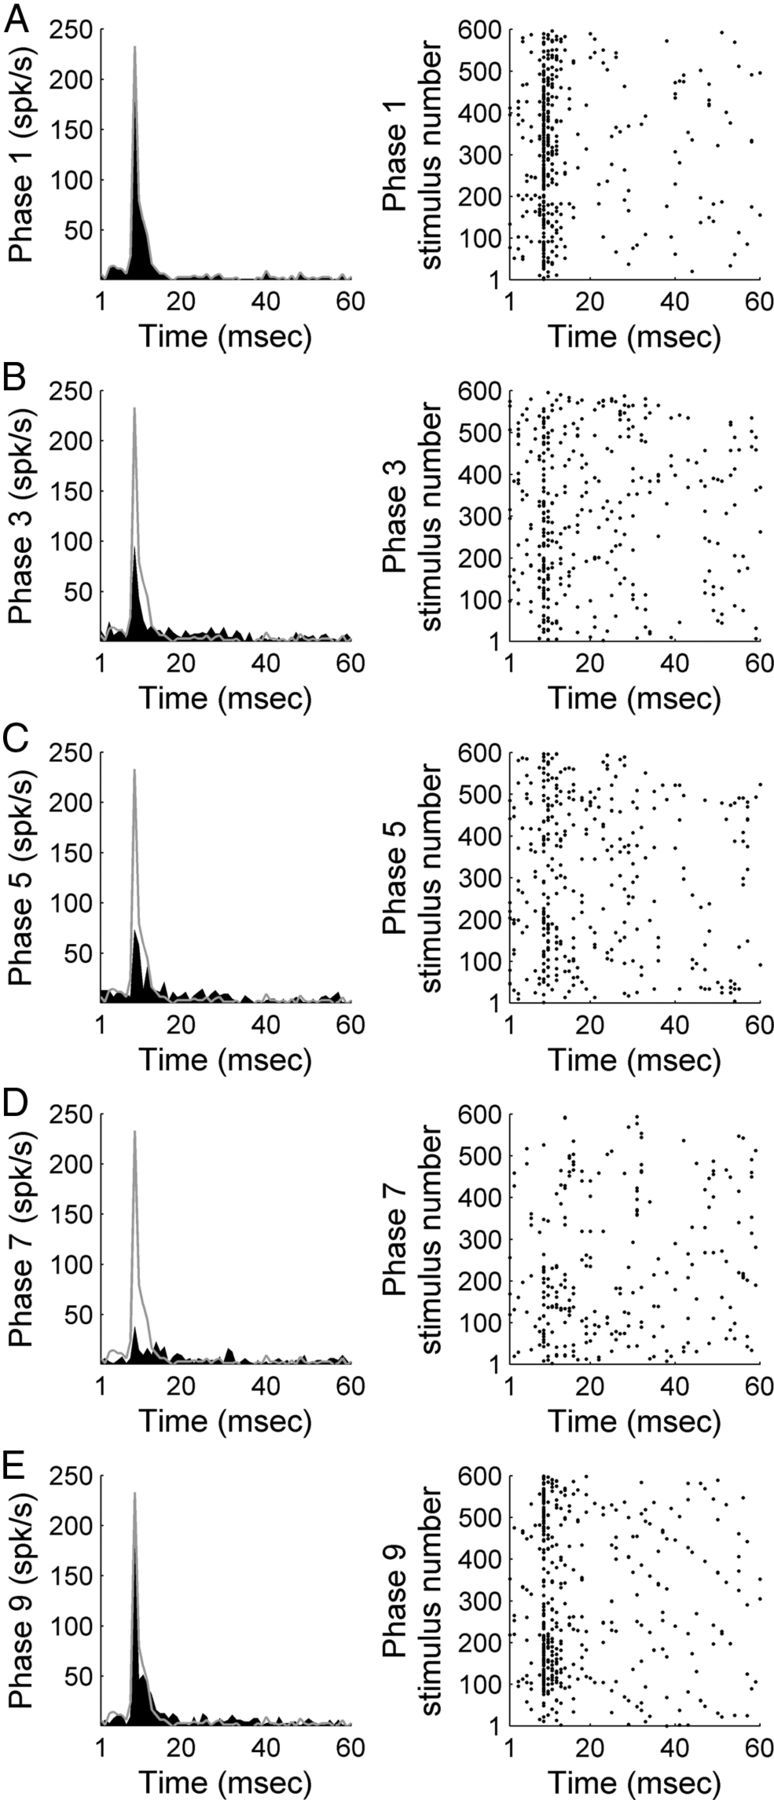
Figure 3.

Representative example of A1 response strength during white noise burst exposure before, during, and after contralateral deactivation of core auditory areas. PSTH and corresponding raster example of a single-unit in A1 before contralateral cooling (phase 1, A), during contralateral A1 cooling (phase 3, B), during simultaneous contralateral A1 and AAF cooling (phase 5, C), during contralateral AAF cooling (phase 7, D), and after contralateral cooling periods (phase 9, E). Gray lines across left column delineate warm (top, phase 1) response level to facilitate comparisons across cooling conditions.
