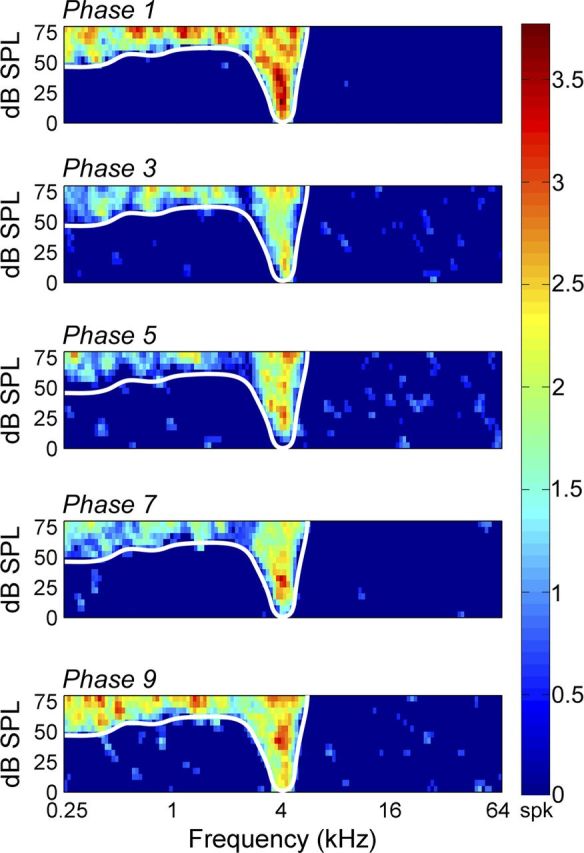
Figure 9.

Representative effect of cooling deactivation on receptive field properties. Panels from top to bottom illustrate receptive field features before cooling deactivation (phase 1), during contralateral A1 deactivation (phase 3), during simultaneous contralateral A1 and AAF deactivation (phase 5), during contralateral AAF deactivation alone (phase 7), and after cooling deactivation (phase 9, rewarm phase). Receptive field borders before cooling (white trace) are illustrated across all phases for comparative purposes. Note the lack of bandwidth variance between warm, cool, and rewarm epochs. Corresponding PSTH activity is presented in Figure 4A.
