Figure 5.
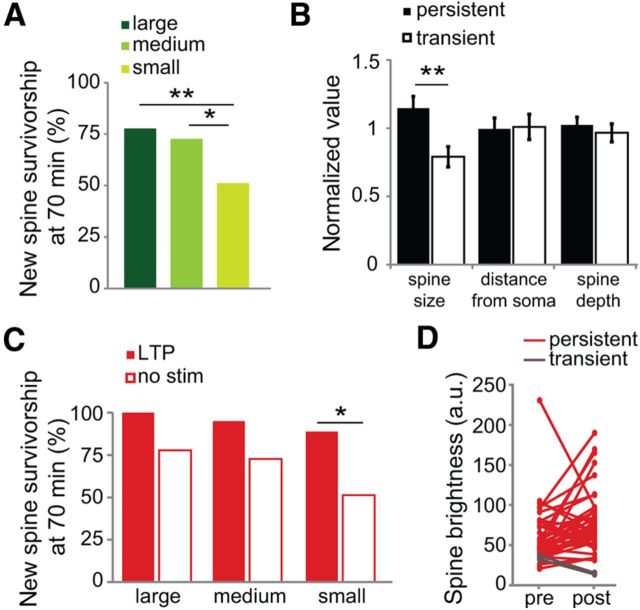
Larger new spines show enhanced survivorship rates. A, Survivorship of medium and large new spines is significantly higher than that of small new spines (p < 0.01, Pearson's χ2 < 36 a.u. = small, 41 spines, 26 cells; 36–60 a.u. = medium, 33 spines, 22 cells; >60 a.u. = large, 36 spines, 23 cells). B, Initial spine size of persistent new spines (open bars) is larger than that of transient new spines (solid bars; p < 0.01, unpaired t test; 60 persistent, 50 transient spines, 37 cells). Distance from the soma (p = 0.9) and spine depth in the slice (p = 0.5) were not different between the two groups. All values are relative to the mean. C, Survivorship of small stimulated (solid bars) new spines is higher than that of small unstimulated (open bars) new spines (p < 0.05, Barnard's exact test; bin sizes and unstimulated (no stim) spine numbers as in A; stimulated: small, 9 spines, 9 cells; medium, 20 spines, 20 cells; large, 13 spines, 13 cells). D, Volume of new spines before (pre) and after (post) stimulation to illustrate volume change of persistent (red lines; 40 spines on 40 cells) and transient (gray lines; 2 spines on 2 cells) new spines.

