
Figure 3.
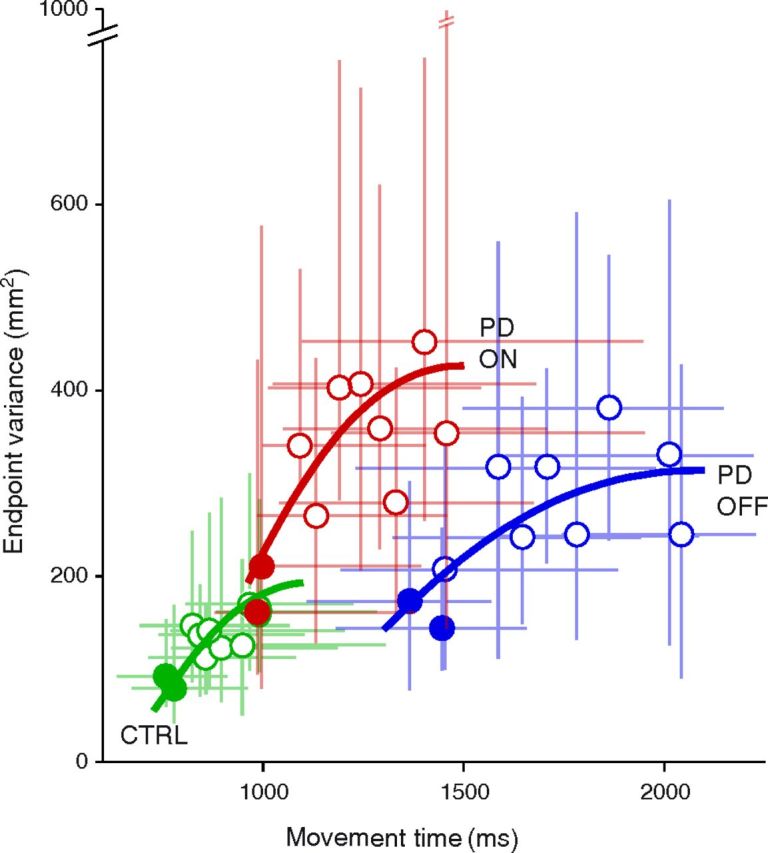
Median endpoint variance as a function of median movement duration. Filled symbols denote the two smallest amplitudes. Blue: PD patients, Off-DBS. Red: PD patients, On-DBS. Green: control subjects. For each group, a fit corresponding to Fitts' law is figured in bold lines of corresponding color (using a system of two equations, MD = a + b.log(A/We) and MD = c + d.A where MD is movement duration, A is movement amplitude, and We the SD of endpoints; see Materials and Methods). Error bars indicate the interval between the first and last quartile.