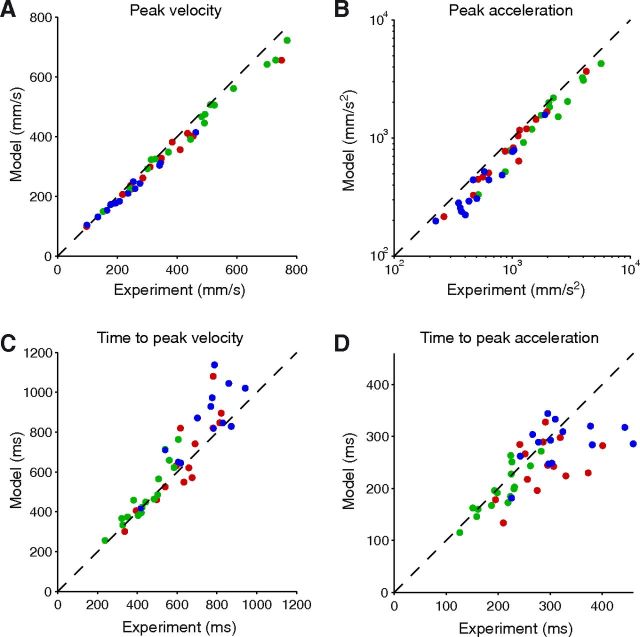
Figure 5.
Results of a minimum-effort model constrained to respect the actual movement durations. The predicted peak velocity (A), peak acceleration (B), time to peak velocity (C), and time to peak acceleration (D) are plotted as a function of the actual data for each PD patient (blue: Off-DBS, red: On-DBS) and control subject (green). Each point corresponds to the median across targets of the median across repetitions to this target. Note the continuum between the results of each group. Dashed line: main diagonal. For clarity, a logarithmic scale was used for B.

