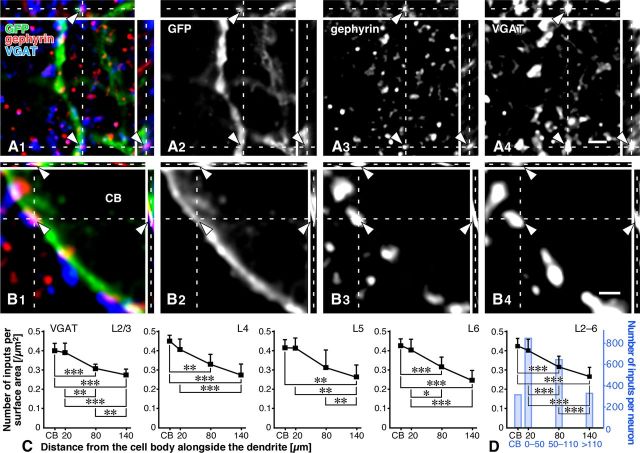
Figure 4.
GABAergic inputs to PV neurons. A1–B4, GFP, gephyrin, and VGAT were labeled with AF488 (green), AF568 (red), and AF647 (blue), respectively. VGAT-positive axon terminals were in close apposition to gephyrin immunoreactivity on the GFP-positive dendrites and cell bodies (arrowheads). C, We estimated the surface area of the dendrites and cell bodies, and then calculated the number of inputs per surface area [/μm2] in each layer (a total of eight neurons in each layer). GABAergic inputs clearly preferred the cell bodies, and the density was almost linearly decreased to the distal dendrites. Each symbol represents mean ± SD. D, The data obtained from all 32 dendrites and cell bodies were pooled. We further estimated the number of total inputs per PV neuron, using the data on the surface area [μm2] and the input density [/μm2]. The number of inputs to the cell bodies in each layer was estimated by the following formula, presuming the cell body to be spherical: [the mean number of inputs per surface area (Table 3)] × 4 × [section area of the cell body (Kameda et al., 2012)]. The number of inputs to the dendrites in each layer was estimated by the formula: D20 × A0–50, D80 × A50–110 and D140 × A≥110, where Dx = [the mean number of inputs per surface area around x μm from the cell body (Table 3)] and Ay = [the total surface area of y μm from the cell body (Kameda et al., 2012)]. Finally, the average number of GABAergic inputs per PV neuron in all layers (blue bars in D) was estimated by the following formula: ∑layer{[the mean number of inputs per PV neurons in each layer] × [the laminar distribution rate (%) of PV neurons in each layer (Kameda et al., 2012)]}. Statistical significance was judged by the Tukey's multiple-comparison test after one-way ANOVA: *p < 0.05; **p < 0.01; ***p < 0.001. Scale bars: (in A4) A1–A3, 2 μm; (in B4) B1–B3, 1 μm.

