
Figure 3.
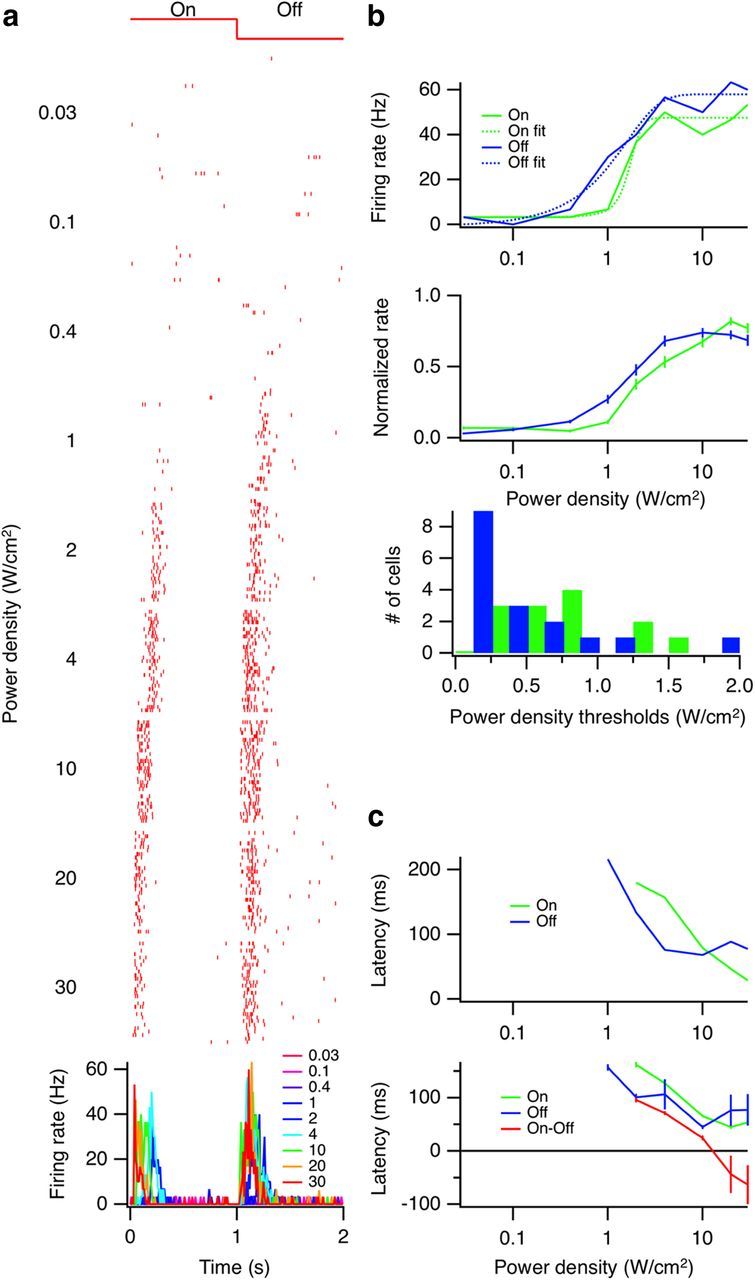
Dependence of response on US power density. a, Top, Raster plots of a single cell at increasing US power levels. Bottom, Superimposed PSTHs (10 ms bins). b, Top, Peak firing rates for On and Off responses for one cell versus power density (solid lines) along with sigmoid fits (dotted lines). Middle, Population summary, On (n = 29) and Off (n = 32) responses shown separately. The peak firing rate of each cell was normalized to its maximum rate. Error bars indicate SEM. Bottom, For cells that were fit well by sigmoid, a threshold was defined at 5% of the minimum–maximum range. A histogram of those thresholds is shown (On median = 754 mW/cm2, Off median = 250 mW/cm2, Wilcoxon-Mann-Whitney two-sample rank test: p = 0.0033, one-tailed). c, Top, Latencies to first spike for the example cell in a. Bottom, Population summary of average latencies. Error bars indicate SEM.