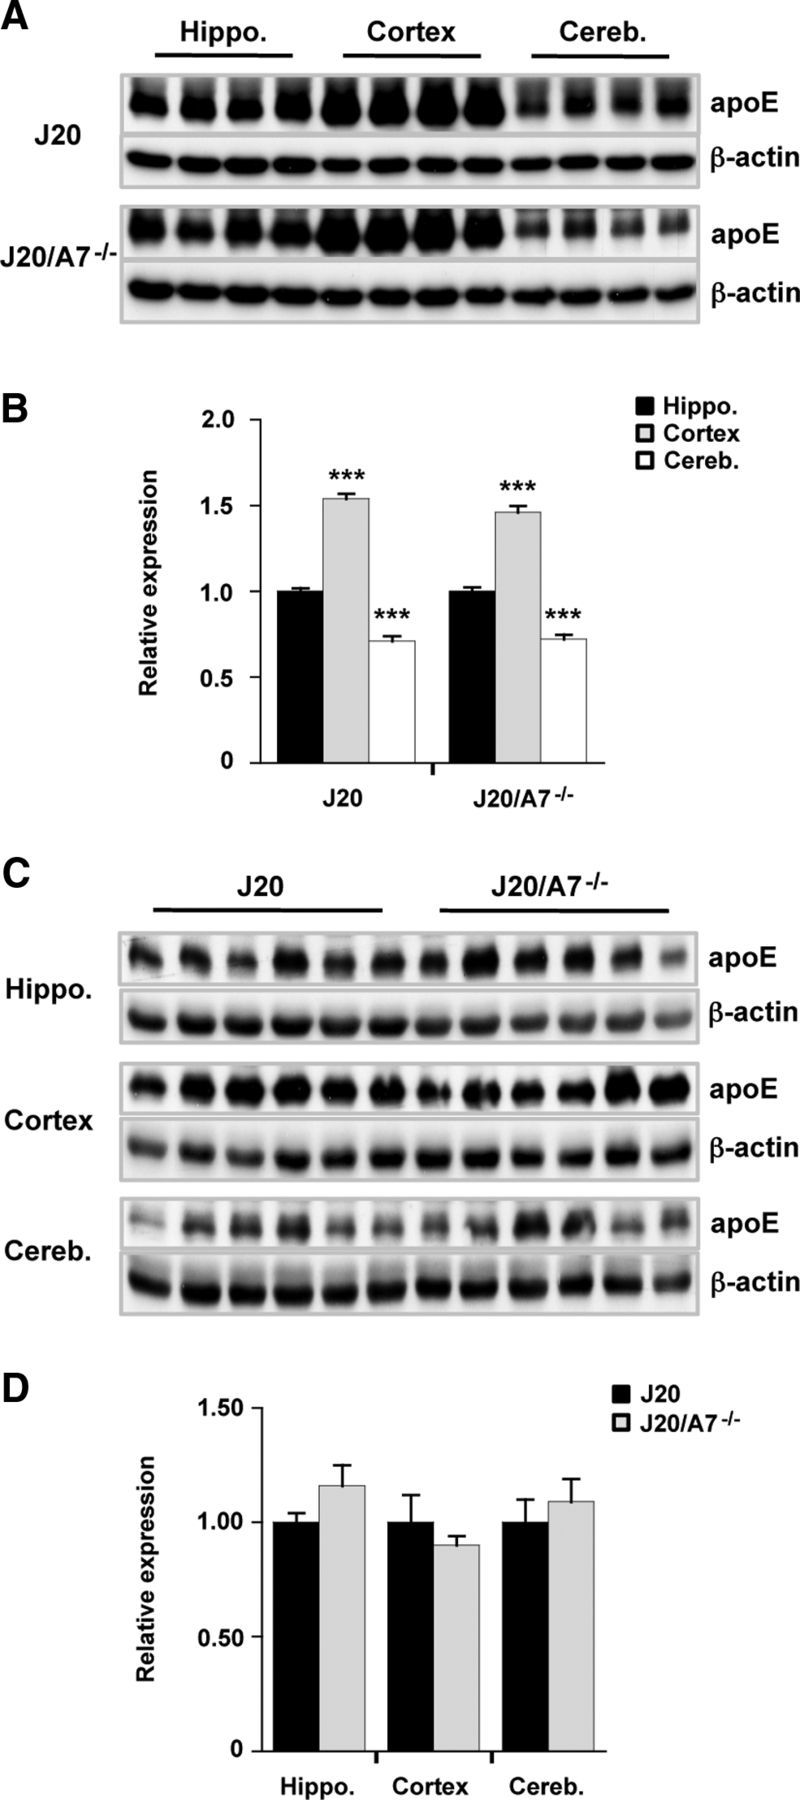
Figure 4.

Impact of ABCA7 deletion on apoE expression in different brain regions. A, C, Brain homogenates were prepared and TBS-soluble fractions were probed for apoE. Representative blots (n = 4 or n = 6 samples for each group) are shown. β-Actin was used as a loading control. B, D, Integrated optical density for blots of all samples (J20, n = 14; J20/A7−/−, n = 11) is shown. Levels are expressed relative to hippocampus (B) or J20 mice (D) and are presented as mean ± SE. ***p < 0.0001 compared with hippocampus.
