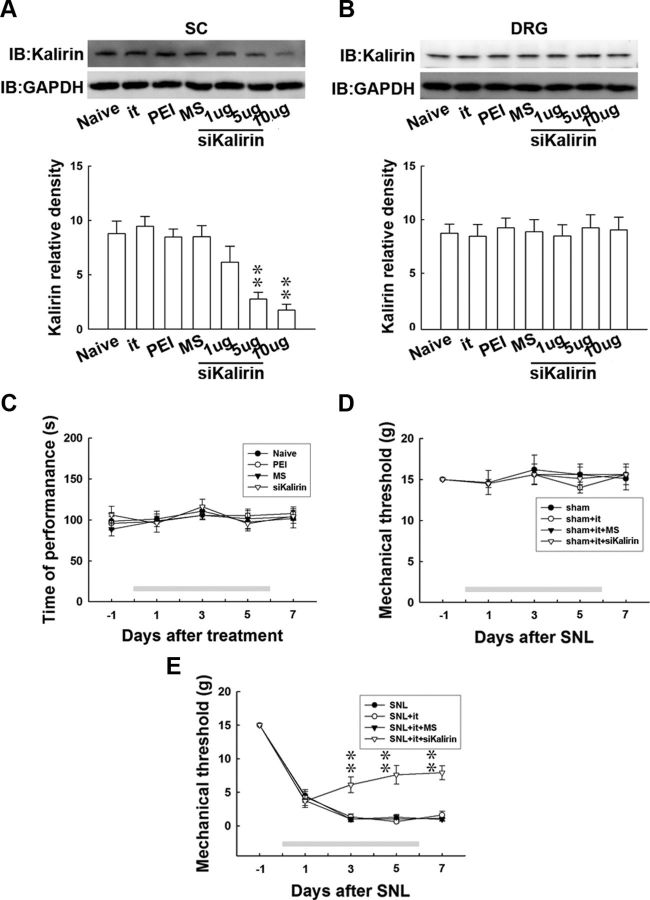
Figure 2.
Kalirin mRNA-targeting siRNA prevents nerve ligation-induced behavioral allodynia. A, Representative Western blot showing kalirin expression in response to administration of siRNA that targeted kalirin mRNA. The level of kalirin was quantified from the lysate of the dorsal horn of the spinal cord (SC, L4–L5), and the level of GAPDH was used as a loading control. Statistical analysis revealed that daily administration of kalirin mRNA-targeting siRNA (siKalirin) at concentrations of 1, 5, and 10 μg (10 μl), but not intrathecal catheter implantation (it), spinal injection of PEI, or missense siRNA (MS), dose-dependently decreased the level of kalirin in the dorsal horn when compared with the naive animals (Naive; **p < 0.05 vs naive, n = 7). IB, immunoblotting. B, In contrast, the level of kalirin in the dorsal root ganglion (DRG) was not affected by any of these treatments (p > 0.05 vs naive, n = 7). C, PEI, missense siRNA (10 μg), and kalirin mRNA-targeting siRNA (10 μg) failed to produce significant differences in rota-rod performance times as measured at days 1, 3, 5, and 7 of treatment when compared with the naive animals (Naive; p > 0.05 vs naive, n = 7). D, All of the treatments, including intrathecal catheter implantation (sham+it), spinal administration of missense siRNA (sham+it+MS), or kalirin mRNA-targeting siRNA (sham+it+siKalirin), failed to produce significant differences in the withdrawal threshold of the von Frey test as measured on days 1, 3, 5, and 7 in sham-operated animals when compared with sham-operated animals without drug administration (p > 0.05 vs sham, n = 7). E, Spinal administration of kalirin mRNA-targeting siRNA (SNL+it+siKalirin), but not administration of missense siRNA (SNL+it+MS) or implantation of an intrathecal catheter (SNL+it) statistically increased the withdrawal threshold tested on days 3, 5, and 7 postsurgery compared with animals that received spinal nerve ligation only (**p < 0.01 vs SNL, n = 7). The gray bar at the bottom indicates the duration of administration. The data show the mean ± SEM.

