Figure 5.

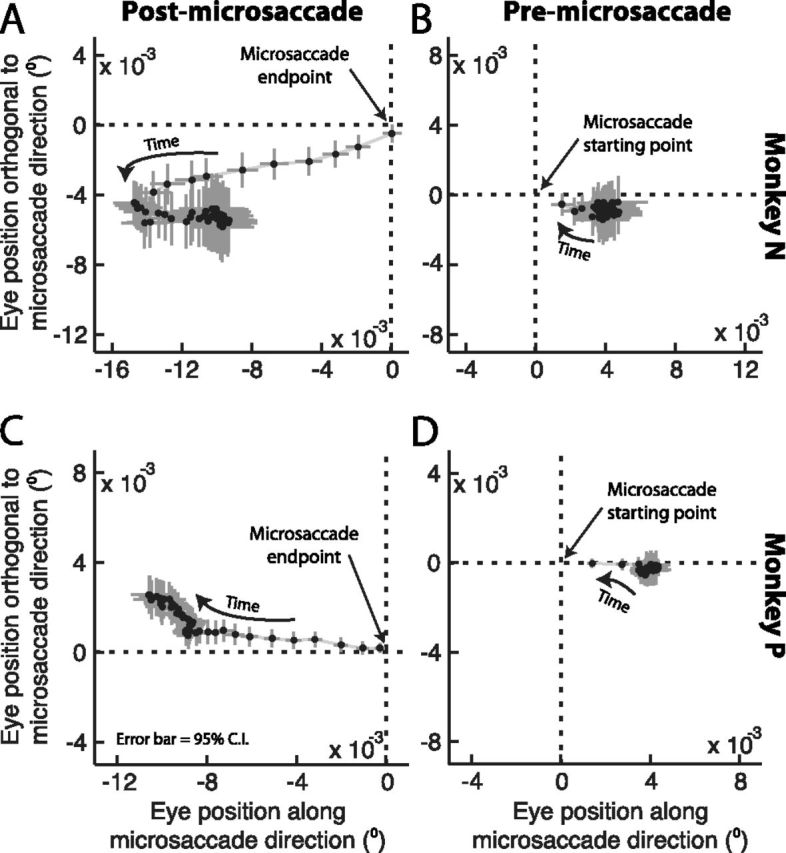
Postmicrosaccadic drift trajectory was related to the antecedent microsaccade direction. A, C, We plotted average eye position in every millisecond following microsaccade end. Each panel plots the first 50 ms of eye drift after microsaccades. Each symbol shows the average ±95% confidence intervals, and the first point after microsaccade end is the point closest to the origin in the figure. The progression of time after a microsaccade is indicated graphically by an arrow. As mentioned in the text, before averaging such eye positions, we first re-aligned all microsaccades according to the direction of the final quarter of microsaccade trajectory, such that rightward horizontal displacements in the figure now correspond to drifts along the same direction as the antecedent microsaccade and upward vertical displacements in the figure correspond to drifts orthogonal to the direction of the antecedent microsaccade. For both monkeys, postmicrosaccadic drift was consistently opposite the final direction of the antecedent eye movement. B, D, Similar analyses but now for eye positions immediately before microsaccade onset. This time, we aligned movements according to the initial microsaccade trajectory such that rightward displacements in the figure are displacements along the upcoming microsaccade direction. Notice how premicrosaccadic drift was slow (strong clustering of the points together) compared with postmicrosaccadic drift, and that it did not exhibit a consistent trajectory.
