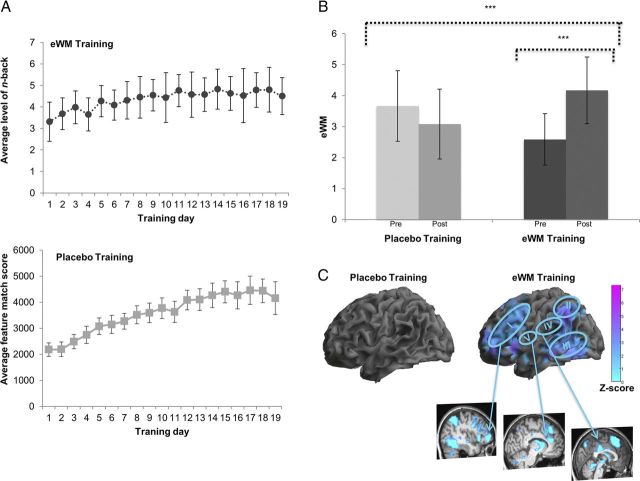
Figure 3.
A, The graphs represent the eWM training (top graph) and placebo training (bottom graph) groups' performance on their respective tasks across training days. For the eWM training, the graph reports average level of n-back achieved across 20 blocks per day; and for the placebo training, a composite score (including raw score, number of attempts, and reaction time) on the feature match task is reported. Error bars indicate SD. B, The behavioral gains in eWM across training plotted as mean peak level of n-back achieved. A mixed-model ANOVA with time (pre-training and post-training) as the within-subjects factor and training (placebo, eWM) as the between-subjects factor yielded a significant interaction, which showed that the augmentation of eWM observed in the eWM training group was significantly greater than the change in the placebo training group (F(1,30) = 16.61, p < 0.001, longer dotted line). Repeated-measures analyses with time (pre-training, post-training) as the within-subjects factor were then conducted in the two groups separately. These revealed that the placebo training did not lead to any significant changes in eWM performance (Δ mean, −0.59; SD, 1.6; p = 0.18). In contrast, eWM training led to a significant pre-training to post-training increase in eWM performance (Δ mean, 1.59; SD, 1.2; p < 0.001, shorter dotted line). Moreover, eWM performance was significantly greater in the eWM training group compared with the placebo training group at post-training (t = −2.79 p = 0.009). ***p < 0.001, two-tailed significance level. Error bars indicate SDs. C, BOLD activation changes during the eWM task from pre-training to post-training conflated across all levels of n-back for the training groups. Significant interactions of training (placebo, eWM) × time (pre-training, post-training) are described in the main text. The absence of behavioral change after placebo training was mirrored by the absence of brain activation changes (left). In contrast, the behavioral gain in eWM after eWM training (right) was associated with decreased neural activation in the (I) left ventrolateral to dorsolateral PFC (Z = 4.10, −42/42/6), (II) bilateral inferior parietal cortex (Z = 4.87, −57/−48/39) and right precuneus (Z = 3.54, 12/−63/36), (III) inferior/middle temporal gyrus (Z = 5.76, 63/−33/−9), (IV) bilateral middle and posterior cingulum (Z = 3.74, −3/−24/33), and (V) left ACC (Z = 2.53, −1/10/25). All regions were significant at the whole brain with significance set at PFDR < 0.05.

