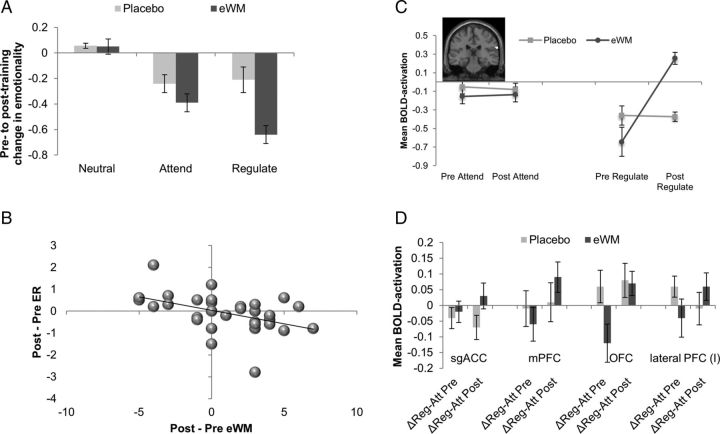
Figure 4.
A, The graph reports mean changes (post-training − pre-training) in emotion ratings for each condition; lower change scores indicate reduced negative affect after training in that condition. B, The graph represents the association between pre-training and post-training changes in ER capacity and changes in eWM. The association is negative because the ER measure represents the pre-training to post-training reduction in reported emotional distress, whereas eWM reports increases in maximum level of n-back achieved at the offline post-training assessment. C, The figure shows the differential effects of eWM training compared with placebo training across time for the Regulate versus Attend conditions in the left superior temporal gyrus. The figure is represented at Puncorrected < 0.001. Error bars indicate SEM. D, The graphs depict the effect of eWM training compared with placebo training across time (pre-training, post-training) for the Regulate versus Attend conditions on BOLD activation in the ROI. Error bars indicate SEM.

