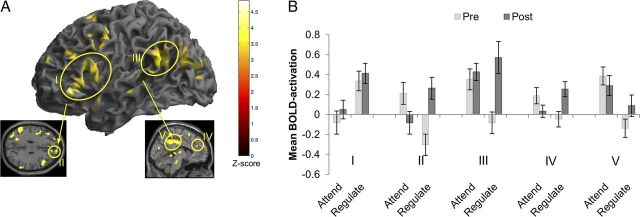
Figure 5.
A, The figure shows brain areas that showed greater BOLD activation increases (a contrast of post-training − pre-training) in the Regulate relative to the Attend condition for the eWM training group only at the whole-brain level of analysis. The figure was thresholded at Puncorrected < 0.001. For a full list of activation details, see Table 8. B, The histograms depict mean BOLD activation during the ER task at pre-training and post-training in the regions reported in Figure 5A, which showed an interactive effect of time (pre-training, post-training) and condition (Regulate, Attend) in the eWM training group. Error bars indicate SEM.

