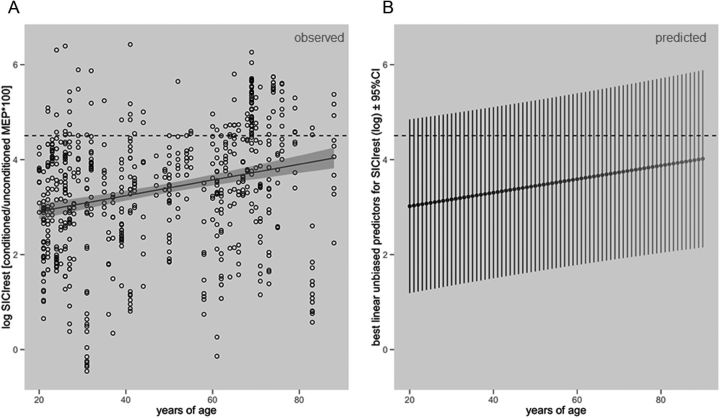
Figure 1.
A, Observed resting-state SICI reduction over lifetime (linear regression line ± 95% CI region). B, Predicted resting-state SICI reduction over lifetime (best linear unbiased predictors ± 95% prediction intervals). SICI is presented as conditioned MEP amplitude/unconditioned MEP amplitude × 100 (log transformed). Red dashed horizontal line indicates 100% SICI (unconditioned = conditioned MEP amplitude on the log scale).

