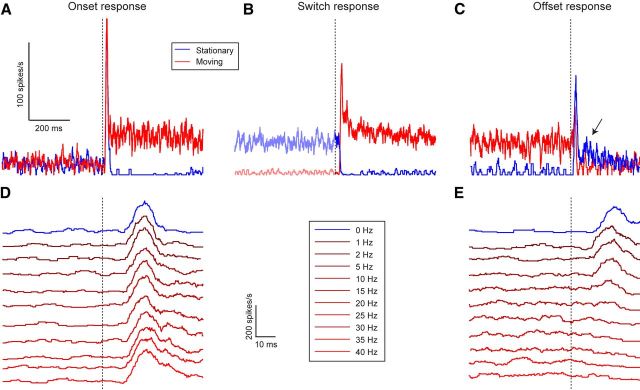
Figure 2.
cSIFE gives strong transient responses to the onset of stimulation. A, The mean response of cSIFE to the onset of motion (red, 6° wavelength, 10 Hz, N = 7, A–C) or of a stationary stimulus (blue, 6° wavelength, 0 Hz). The dashed vertical line indicates stimulus onset. B, The mean response to a phase-aligned sinusoidal grating switching from motion (6° wavelength, 10 Hz) to stationary (blue), or vice versa (red). The dashed vertical line indicates the time of the switch. C, The response of cSIFE to the offset of motion (red, 6° wavelength, 10 Hz) or of a stationary stimulus (blue, 6° wavelength, 0 Hz). The dashed vertical line indicates stimulus offset. The scale bar is shared between A–C. D, The onset transient for different temporal frequencies (N = 11). E, The offset transient for different temporal frequencies (N = 11). The scale bar and legends are shared between D, E.

