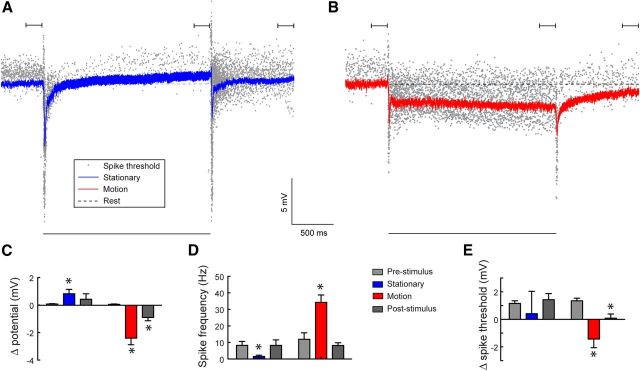
Figure 4.
Paradoxical relationship between the membrane potential and the spike rate. A, The response of cSIFE to an inhibitory stimulus (full-contrast sinusoidal grating, 6° wavelength, 0 Hz). The blue line shows the mean membrane potential and the gray dots the spike threshold for every detected action potential (N = 5, n = 138). B, The response to a moving grating (6° wavelength, 5 Hz). The red line shows the mean membrane potential and the gray dots the spike threshold for each action potential (N = 5, n = 38). The black bars above A, B indicate the analysis windows used in C–E. The black bar below A, B indicates the peristimulus duration. C, The mean membrane potential difference measured for the last 200 ms before stimulus onset (gray), the last 200 ms of stimulation (blue and red), and 800–1000 ms poststimulus offset (dark gray). The time points are indicated above the data in A, B (N = 5). D, The mean spike frequency before, during and after visual stimulation (N = 5). E, The action potential threshold difference before, during, and after visual stimulation. (N = 5, except for the blue data where one neuron was completely quiet within the analysis window, and therefore no threshold could be determined, giving N = 4). Stars indicate significant difference (p < 0.05, paired t test) compared with prestimulus levels.

