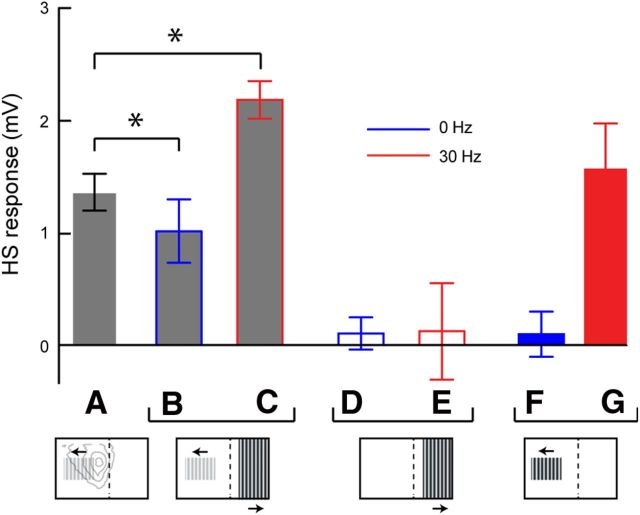
Figure 6.
Stimuli that drive cSIFE affect the response of HS neurons. A, The response of HS to a sinusoidal grating patch (6° wavelength, 5 Hz, 10% contrast) in the ipsilateral visual field. In the figure below, the gray contours show the receptive field of male HSN (Nordström et al., 2008) and the dashed line the visual midline. B, HS response to the same patch with simultaneous display of a stationary grating in the contralateral visual field (6° wavelength, full contrast). C, HS response to the same patch with simultaneous display of a moving grating in the contralateral visual field (6° wavelength, 30 Hz). Asterisks indicate significant difference (p < 0.05, paired t tests) compared with A. D, HS response to a stationary, full-contrast sinusoidal grating in the contralateral visual field. E, HS response to a moving full-contrast sinusoidal grating in the contralateral visual field (30 Hz). F, HS response to an ipsilateral, stationary, sinusoidal grating (6° wavelength, 0 Hz, full-contrast). G, HS response to an ipsilateral, moving, sinusoidal grating (6° wavelength, 30 Hz, full-contrast. N = 5, except in F, G where N = 4).

