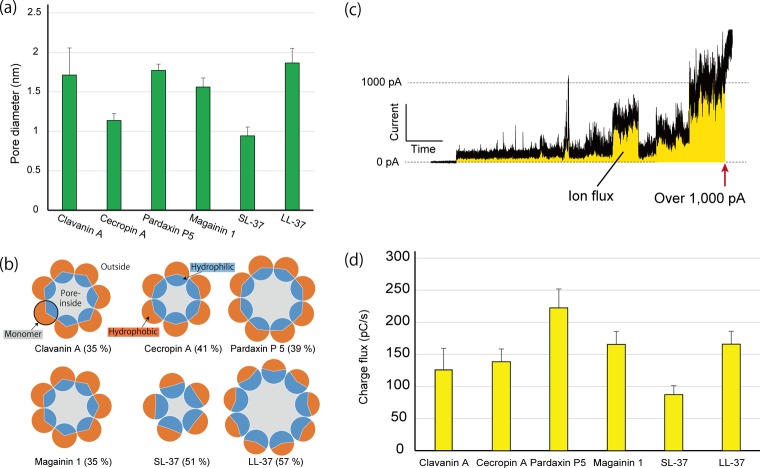
Figure 4.
Analysis of pore-forming activity. (a) Pore diameter and (b) number of assembling monomers with hydrophobicity percentage (hydrophobic residues/all residues) of AMPs calculated from step signals. (c) Diagram of charge flux estimation. The yellow area indicates the total charge flux through the membrane pore or defect. (d) Results of the charge flux in AMPs.

