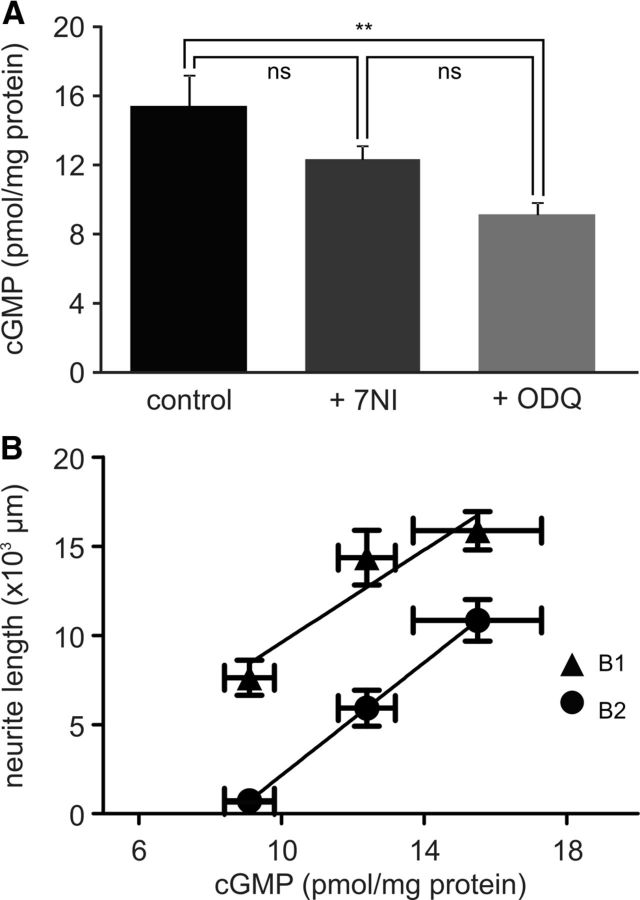
Figure 6.
cGMP concentration in the isolated CNS. A, Average cGMP concentration measured in isolated whole CNS preparations maintained for 1 d in tissue culture under control conditions (control) or in the presence of either 7NI (0.25 mm) or ODQ (0.4 mm). Groups were compared using an ANOVA followed by NK post hoc tests. *p < 0.05. B, Plot of the average total neurite length of B1 and B2 neurons under the three different conditions (DIV2+, DIV2+/7NI, DIV2+/ODQ) against the average cGMP concentration under equivalent conditions (control, + 7NI, + ODQ).

