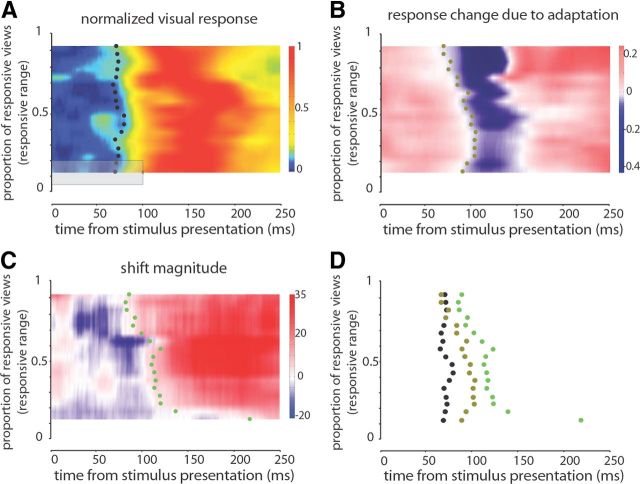
Figure 8.
Adaptation modulates activity of neurons responding to a wide range of face views before neurons responding to a smaller range. The average normalized responses for groups of neurons with various responsive ranges are shown in A. To determine the value for each point (e.g., the small x), the responses over a window of 100 ms and a responsive range of 0.3 were averaged together (indicated by the gray rectangle). The small x was shifted with steps of 1 ms and 0.05 of responsive range. Small black dots indicate the average visual latency for each group of neurons. Whereas visual latency is not a factor of responsive range, adaptation-induced response changes appear earlier in neurons with wider responsive range as it is shown in B. Using the same averaging window as A, response change, defined as change in normalized response after adaptation compared with before adaptation, is illustrated in B. The small dots indicate the first significant negative response change for each group of neurons. C illustrates the shift magnitude, the measure of repulsive shift, for different groups of neurons. The averaging window is similar to A and B. Note that the first significant positivity in shift magnitude appears earlier for neurons with wide responsive range. Small dots indicate the first significant positive shift for each group of neurons. D summarizes the relative timing of visual latency, onset of response suppression, and onset of positive change in shift magnitude for various groups of neurons.

