
Figure 1.
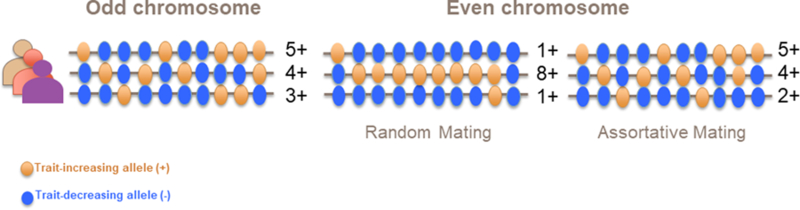
Schematic illustration of the effect of assortative mating (AM) on the correlation between trait-associated alleles. Each line represents a chromosome of an individual in the population and each coloured bead represents an allele (orange: trait-increasing alleles (TIA); blue: trait-decreasing alleles) at a particular locus on that chromosome. Under random mating, the distribution of alleles between odd and even chromosomes are uncorrelated (no-consistent pattern between chromosomes). Under AM, the distributions of alleles are correlated between chromosomes, such that the number of TIAs on odd chromosomes predicts the number of TIAs on even chromosomes.