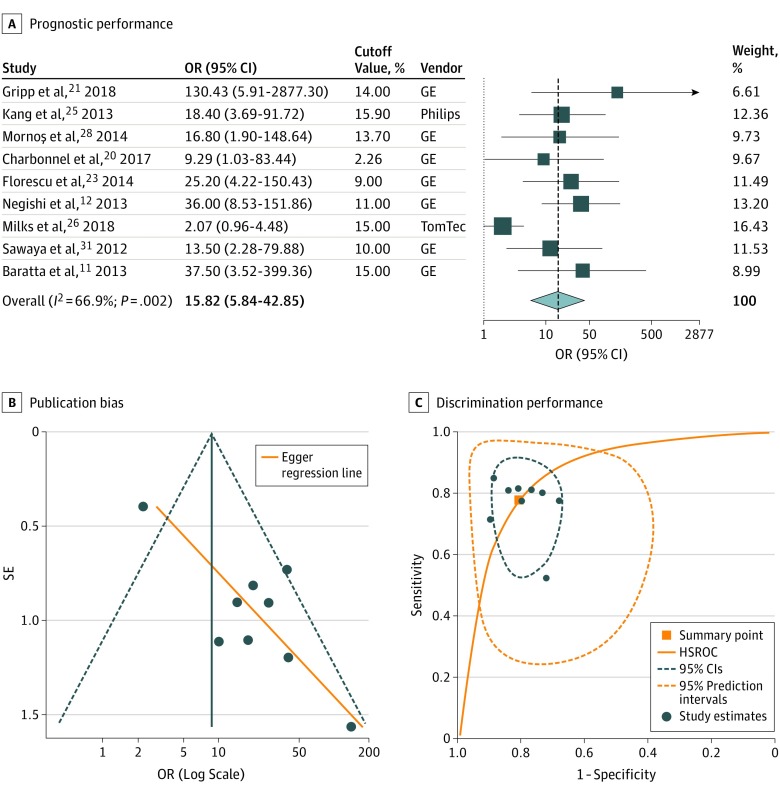
Figure 4. Prognostic and Discriminatory Performance of Relative Change in GLS Compared With a Baseline Value for Cancer Therapy–Related Cardiac Dysfunction .
A, Forest plot representing the odds ratios (ORs) for each reported cutoff value in each study as well as the overall summary ORs. Weights are taken from random-effects analysis. The estimated 95% prediction intervals for the overall summary OR are 0.74 to 338.11. GE indicates GE EchoPAC software (General Electric); Philips, QLAB (Philips Medical System); and Tomtec, 2D Cardiac Performance Analysis (TomTec Imaging Systems). B, Funnel plot with Egger regression line for assessment of publication bias (P = .003). C, The orange square represents the summary operating point of the curve, a hypothetical point that summarizes the discriminatory value of all cutoff values (sensitivity, 0.78; 95% CI, 0.63-0.88; specificity, 0.81; 95% CI, 0.72-0.87; positive likelihood ratio, 4.05; 95% CI, 2.65-6.21; negative likelihood ratio, 0.27; 95% CI, 0.15-0.49). The area under the hierarchical summary receiver operating characteristic curve (HSROC) was 0.86 (95% CI, 0.83-0.89).

