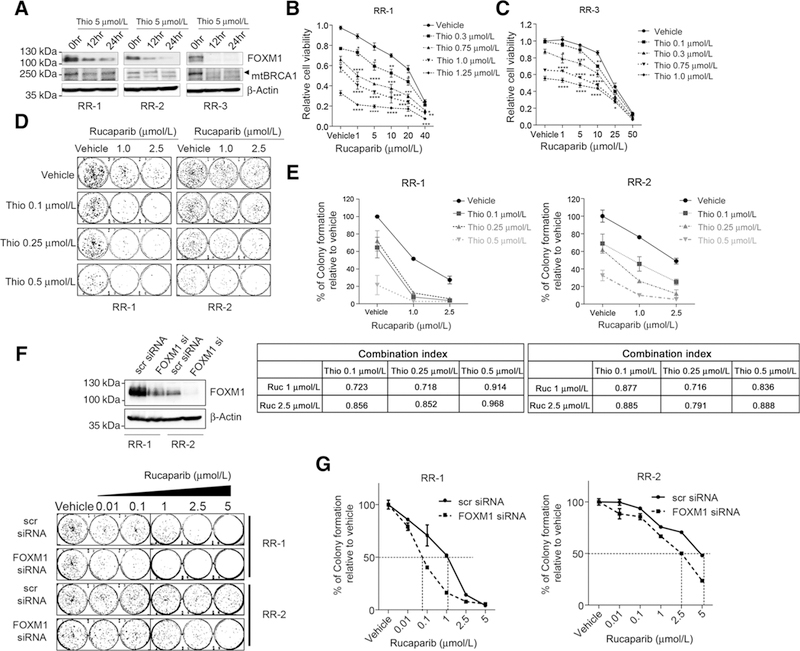
Figure 7.

Thiostrepton sensitizes rucaparib-resistant cells by downregulating FOXM1 and mutant BRCA1. A, FOXM1 and mutant BRCA1 (mtBRCA1) decrease by thiostrepton treatment. Three rucaparib-resistant cells (RR-1, RR-2, and RR-3) were treated with 5 μmol/L thiostrepton for 0,12, or 24 hours and the FOXM1 and mutant BRCA1 protein levels were measured by immunoblotting. B and C, Synergistic effects of thiostrepton and rucaparib in rucaparib-resistant cells RR-1 (A) and RR-3 (B). Rucaparib-resistant cells were derived from MDA-MB-436 cells after long time exposure of rucaparib (9). 5000 cells were seeded in 96-well plates and treated with thiostrepton or olaparib alone or combinations of both drugs for 3 days before SRB assay. Cell survival curves were generated in the presence of vehicle (set as 100% of survival) or thiostrepton following increasing concentrations of rucaparib. Data were shown as mean ± SEM in a line graph. The statistics analysis was fulfilled with two-tailed Student t test. *, P ≤ 0.05; **, P ≤ 0.01; ***, P ≤ 0.001; ****, P ≤ 0.0001. Results represent experiments with four replicates. D and E, Colony formation assay of rucaparib-resistant cells RR-1 and RR-2 with thiostrepton and rucaparib. RR-1 and RR-2 cells were seeded in 6-well plates and treated with vehicle or rucaparib with or without thiostrepton. The colony formation results were shown in (D) and quantified in E, data shown as mean ± SEM. Combination index (CI) for each combination was shown underneath. F and G, Colony formation assay after FOXM1 knockdown with siRNA. F, RR-1 and RR-2 cells were transfected with scr siRNA or FOXM1 siRNA and waited 48 hours before seeding for clonogenic assay. Cells were treated with increasing concentrations of rucaparib for 3 days and allow colonies to form for 18 days. Colonies were stained with SRB and imaged. Cell lysates were collected around 72 hours after siRNA transfection and subjected to Western blot analysis to check FOXM1 knockdown efficiency. G, Quantification of relative colony formation. Stained colonies from F were solubilized in Tris buffer and measured fluorescent intensity. Data are shown as mean ± SEM of the percentage of colony formation relative to the vehicle of scr siRNA or FOXM1 siRNA, respectively. Results represent experiments performed in duplicates (D-G).
