Figure 5.

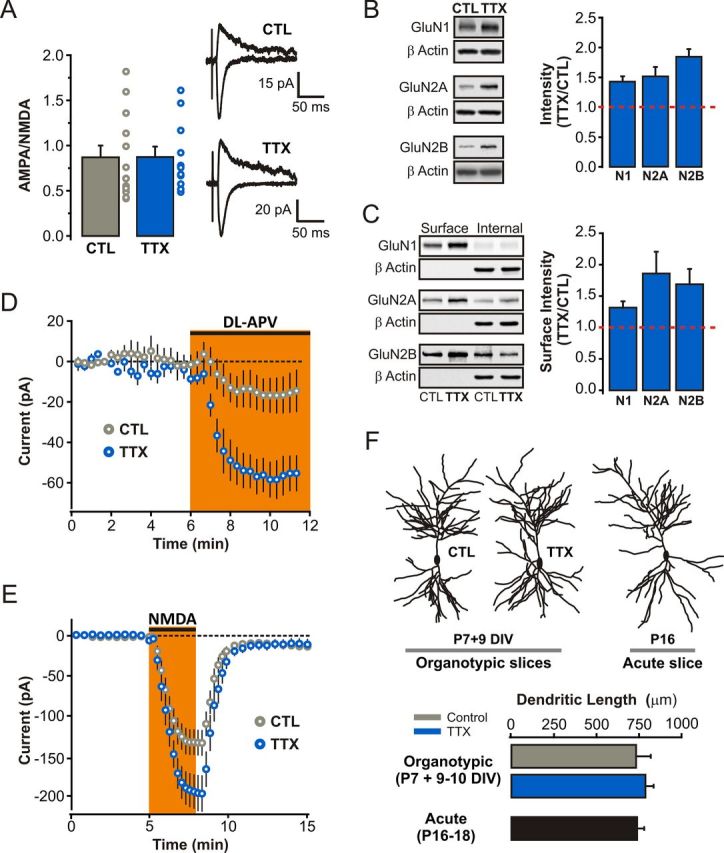
Homeostatic upregulation of surface NMDARs in CA1 pyramidal neurons in response to prolonged TTX treatment. A, AMPA/NMDA ratio of evoked EPSCs (see Materials and Methods). B, Representative Western blots and quantification of changes in NMDAR subunit expression, plotted as a TTX/CTL ratio of band intensity, in hippocampal lysates of control and TTX-treated slices. All bands were normalized to β-actin before calculating the TTX/CTL ratio. C, Representative Western blots of biotinylated (surface) and nonbiotinylated (internal) fractions from control and TTX-treated slices. Relative surface expression of NMDA receptor subunits between control and TTX-treated slices plotted as a TTX/CTL ratio of band intensity. D, Change in holding current induced by bath administration of 50 μm dl-APV while holding the neurons at +40 mV (p < 0.05, unpaired Student's t test). These experiments were performed with NBQX, picrotoxin, and TTX in the Ringer's solution. E, Amplitude of the inward current induced by bath administration of NMDA (5 μm; Vm = −60 mV in 0.1 mm Mg2+). All NMDA bath administration experiments were performed with NBQX, picrotoxin, and TTX in the Ringer's solution. F, 2P images of filled CA1 pyramidal neurons were reconstructed using Neuron Studio software (see Materials and Methods). Dendritic length (in micrometers) is plotted for CA1 pyramidal neurons from TTX-treated or control organotypic slices (P7 and 9–10 DIV) and from age-matched neurons from acute slices (P16–P17 animals; n = 10, 12, and 9 neurons for control, TTX-treated, and acute slices, respectively).
