Figure 4.
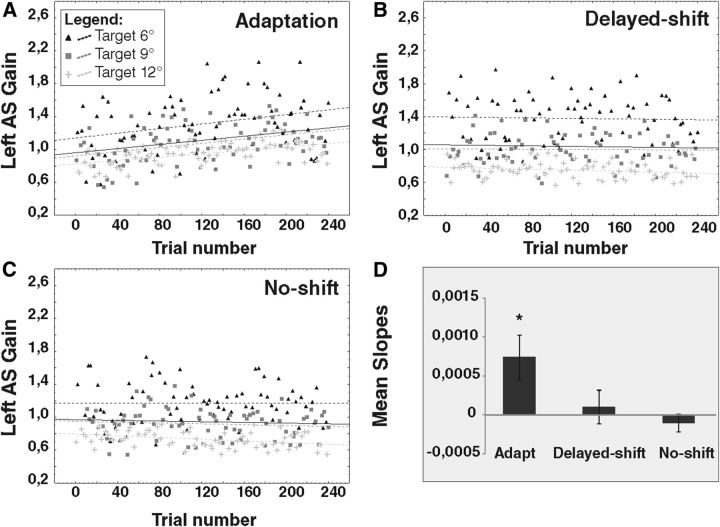
Regression slopes of left AS gain for one representative subject (subject 4) during exposure phases. The gain of leftward AS (L-AS) performed during the exposure phase of the adaptation condition (A), delayed-shift condition (B), and no-shift condition (C) is represented separately for each target (6°, black triangles; 9°, dark gray squares; 12°, light gray plus signs). Dotted lines represent the slopes of the linear relationship between AS gain and trial number for each target. Black thick line represents the slope of the averaged relationship of the three target eccentricities pooled together. In the adaptation condition, the slope of all three relationships (6°, 9°, 12°) between AS gain and trial number is significantly larger than 0. In the no-shift condition, the slope of the 12° relationship is significantly smaller than 0. All other relationships are not significant. D represents the slopes averaged over all subjects separately for each condition. Asterisk indicates significant differences relative to 0 (t tests).

