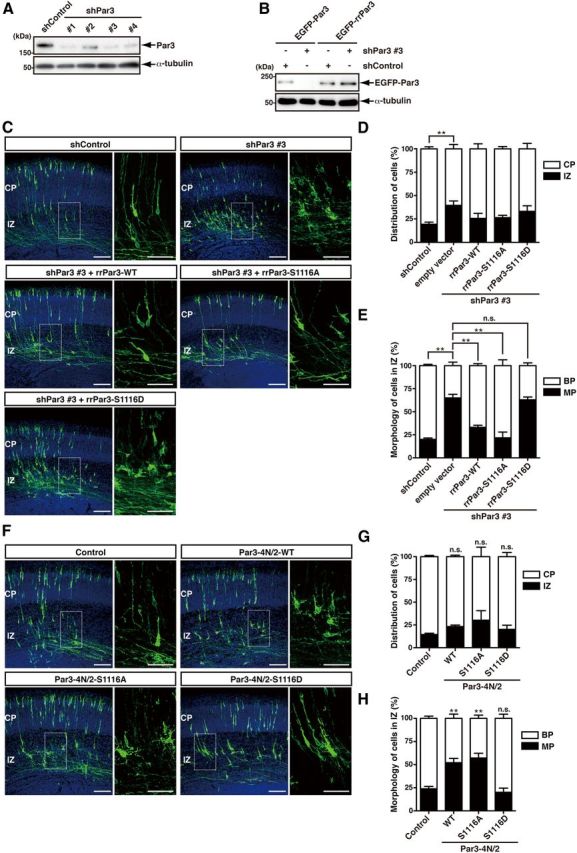
Figure 8.

The effect of mutations of Par3 at phosphorylation sites on neuronal polarity in vivo. A, pSico-mCherry (shControl), pSico-mCherry-shPar3 #1, -shPar3 #2, -shPar3 #3, or -shPar3 #4 were cotransfected into Neuro2a cells with pEF-Cre. After 72 h, the cells were lysed and subjected to immunoblotting with anti-Par3 and anti-α-tubulin antibodies. B, pEGFP-Par3 or RNA-interference-resistant pEGFP-Par3 (pEGFP-rrPar3) were cotransfected into COS7 cells with pSico-mCherry or pSico-mCherry-shPar3 #3 with pEF-Cre. After 72 h, the cells were lysed and subjected to immunoblotting with anti-GFP and anti-α-tubulin antibodies. C, Tα-LPL-Lyn-EGFP was coelectroporated with Tα-Cre and pSico-mCherry, pSico-mCherry-shPar3 #3 or pSico-mCherry-shPar3 #3, and RNAi-resistant Par3 mutants into the cerebral cortices at E13 followed by fixation at E16. Coronal sections were prepared and immunostained with anti-GFP antibody (green). Nuclei were stained with Hoechst 33342 (blue). Scale bars: left, 100 μm; right, 50 μm. D, Quantifications of the distribution of EGFP-positive cells in distinct regions of the cerebral cortex (CP and IZ) for each experimental condition are shown on the graph. E, The percentage of EGFP-positive cells with bipolar (BP) or multipolar (MP) morphologies in the IZ of the cerebral cortex. Error bars represent the SEM. shControl + empty vector, n = 4; shPar3 #3 + empty vector, n = 4; shPar3 #3 + rrPar3-WT, n = 3; shPar3 #3 + rrPar3-S1116A, n = 3; shPar3 #3 + rrPar3-S1116D, n = 4. *p < 0.05 (Tukey's multiple-comparison test). **p < 0.01 (Tukey's multiple-comparison test). n.s., Not significant. F, pTα-LPL-Lyn-EGFP was coelectroporated with Tα-Cre and pTα-LPL (control), pTα-LPL-Par3-4N/2-WT, -S1116A, or -S1116D into the cerebral cortices at E13 followed by fixation at E16. Coronal sections were prepared and immunostained with anti-GFP antibody (green). Nuclei were stained with Hoechst 33342 (blue). Scale bars: left, 100 μm; right, 50 μm. G, Quantifications of the distribution of EGFP-positive cells in distinct regions of the cerebral cortex (CP and IZ) for each experimental condition are shown on the graph. H, The percentage of the EGFP-positive cells with bipolar (BP) or multipolar (MP) morphologies in the IZ of the cerebral cortex. Error bars represent the SEM. Control, n = 6; pTα-LPL-Par3-4N/2-WT, n = 4; pTα-LPL-Par3-4N/2-S1116A, n = 3; pTα-LPL-Par3-4N/2-S1116D, n = 5. **p < 0.01 (Dunnett's multiple-comparison test). n.s., Not significant versus control.
