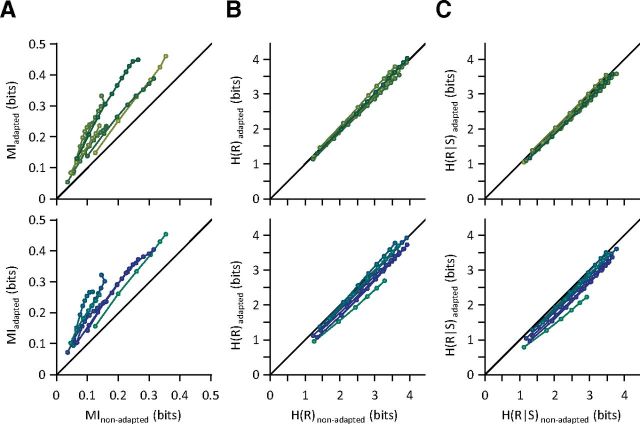
Figure 3.
Population information content and entropy. A, MI between pooled neuronal responses and the whole stimulus set for the 6 μm adaptation state (top) and 12 μm adaptation state (bottom) versus the non-adapted state. B, As in A but plotting the entropy of the pooled neuronal response. C, As in A but plotting the conditional entropy of the pooled neuronal response. Each point corresponds to a population size. For each population size, the values for all possible selections of that size were averaged within each session. Each line connects different population sizes within a session of simultaneously recorded single neurons. Within each session, MI and entropies increase with population size. For better visibility, multiple levels of brightness are used for different sessions.

