
Figure 2.
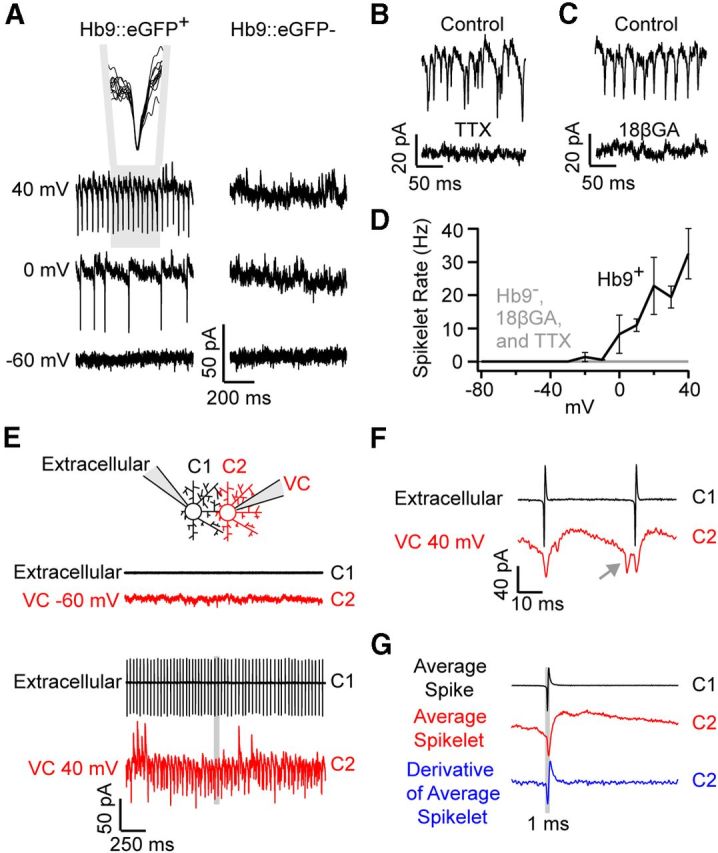
Superior coding Hb9+ DSGCs exhibit coupled spikelets. A, Upon voltage-clamping the membrane potential above ∼0 mV, fast inward currents (spikelets) were observed in Hb9+ (left), but not Hb9− (right) ON-OFF DSGCs. The inset in A shows the overlay of 10 consecutive spikelets, indicating their uniform size and waveform. B, C, Depolarization-induced spikelets were abolished in the presence of 1 μm TTX (a voltage-gated Na+ channel blocker; B) and in the presence of 25 μm 18βGA (gap junction blocker; application 10–20 min; C). D, Spikelet frequency plotted as a function of holding potential. E, An example of a paired recording from neighboring DSGCs, in which spike activity in C1 was measured in cell-attached mode, while whole-cell voltage-clamping (VC) its neighbor (C2) near −60 mV (top) or +40 mV (bottom). F, A high-resolution view of the area highlighted in gray in E, showing spikelets (red) immediately follow action potentials in C1 (black). The gray arrow points to a spikelet that does not correspond to an action potential in C1, which likely arose from an action potential in another DSGC that is coupled to C2. G, The average of spike waveforms in C1 (black) and C1 spike-triggered average of currents in C2 (red, VHOLD ∼0 mV) are plotted for the pair of cells shown in E. The derivative of the average spikelet (blue) appears as a low-pass-filtered version of the spike measured in C1 (black).