
Figure 6.
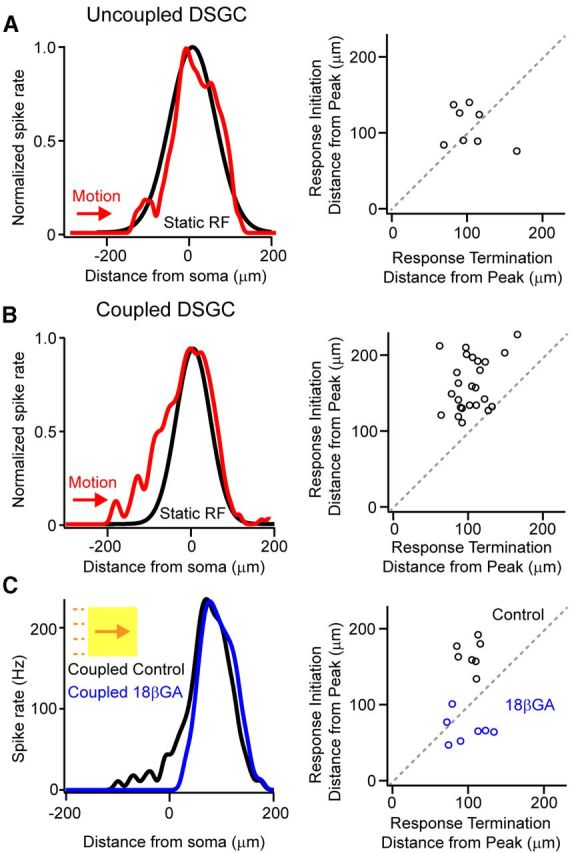
Moving stimuli evoke responses outside the classical receptive field of coupled DSGCs. A, B, A Gaussian approximation of the classical receptive field (mapped with a 40 μm spot) for an uncoupled (A, left, black) and a coupled DSGC (B, left, black). The spiking response to a bar (300 × 300 μm bar; 96% Weber contrast) moving at 600 μm/s in the preferred direction is plotted in relation to the leading edge of the moving stimulus (the leading edge of the stimulus is at the soma at 0 μm; red traces). The response waveform to moving stimuli was shifted ∼36 μm to account for the distance the edge traveled during the ∼60 ms processing delay time (see Materials and Methods). For each cell tested, the location where responses initiated is plotted against the location where responses terminated, with respect to the location of the peak spike rate (A, B, right). Values that fall on the diagonal represent symmetrical responses, whereas points that fall above the diagonal represent responses that are skewed toward the leading edge of the response. C, Application of the gap junction blocker 18βGA selectively affects the rising phase of the response of coupled DSGCs to moving stimuli. Plotting the relative location where responses initiated versus the location where responses terminated (with respect to the location of the peak rate) reveals that responses are more symmetrical in the presence of 18βGA (black vs blue).